
- Title
-
Proteostasis governs differential temperature sensitivity across embryonic cell types
- Authors
- Dorrity, M.W., Saunders, L.M., Duran, M., Srivatsan, S.R., Barkan, E., Jackson, D.L., Sattler, S.M., Ewing, B., Queitsch, C., Shendure, J., Raible, D.W., Kimelman, D., Trapnell, C.
- Source
- Full text @ Cell

Effects of stress on phenotypic variability are captured via individual animal hashing of single-cell transcriptomes (A) Representative images of 24 hpf embryos raised at standard and elevated temperature; individual embryos with normal-looking and bent-tail phenotypes were included in the dataset. (B) Experimental workflow for temperature perturbation experiment and individual embryo hashing. (C) Uniform manifold approximation and projection (UMAP) of temperature-perturbation dataset, projected into coordinate space of reference atlas (see Saunders et al.32). Right side shows how single-cell data are transformed to generate cell composition matrices. |

Staging embryos by cell type composition captures temperature-induced acceleration of development and allows isolation of temperature-dependent effects on cell abundance (A) UMAP of embryo trajectory produced using all individual embryos from the developmental reference; each segment of the principal graph represents a 2-h window of development, with key events noted. Right panel shows how, at each time point, embryos from elevated temperature are “ahead” of their 28°C counterparts on the embryo stage trajectory (median pseduostage for each temperature indicated with horizontal bars). (B) Scatterplot showing mean pseudostage values are correlated with expectations from a linear model of temperature-induced acceleration of developmental rate; error bars represent standard deviation. The result of linear regression is shown in black. (C) Scatterplot showing mean pseudostage values for all embryos in the reference dataset compared with a nearest-neighbor label transfer in transcriptome space; error bars on both axes represent standard deviation; both cell composition and transcriptomes contain ample information on developmental stage. (D) Heatmap showing the effects of temperature on mean cell type abundance relative to untreated, stage-matched controls (left) and on variability (CV relative to controls) of cell counts (right). Significant tests (q < 0.05) from beta binomial regression are indicated with a black box. Each column represents a pseudostage bin, wherein embryos from untreated and treated samples are stage matched. (E) UMAP of all cell types, colored by relative abundance change in severe (bent) individuals raised at 34°C compared with normal-looking embryos also raised at 34°C. |
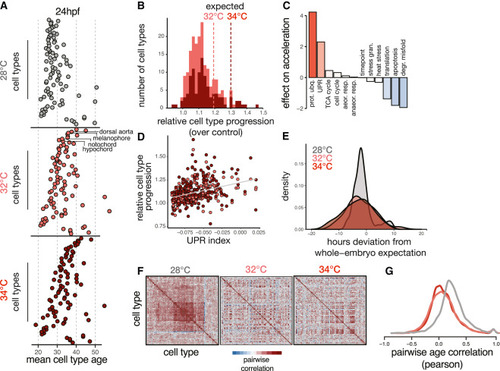
Temperature introduces asynchrony in developmental rate across cell types (A) Dot plots showing the transcriptional ages of all cell types at 24 hpf, faceted by temperature. Cell types on the y axis are ordered by their relative acceleration at 34°C, highlighting the most sensitive cell types near the top and insensitive types near the bottom. Cell type ordering is the same for all temperatures; specific examples are indicated with labels. (B) Histogram showing distributions of relative cell type progression at each temperature, with vertical lines showing the relative progression expected for the whole embryo. (C) Bar plot showing the effect sizes for expression levels of several cellular processes related to metabolism, protein folding, proliferation, and stress response in an additive model predicting relative progression of the cell type at high temperature. (D) Scatterplot showing basal levels of the UPR in each cell type against its relative progression, revealing a positive trend for both temperatures. (E) Density histogram showing increased variance in developmental stage for embryos raised at elevated temperature. (F) Heatmaps showing pairwise correlation coefficients of transcriptional age for all cell types in the embryo; at 28°C, most cell type pairs are positively correlated across individual embryos, whereas this correlation structure is diminished at elevated temperatures. (G) Density histogram of pairwise correlation values at each temperature, summarizing the loss in correlation structure seen in (F). |
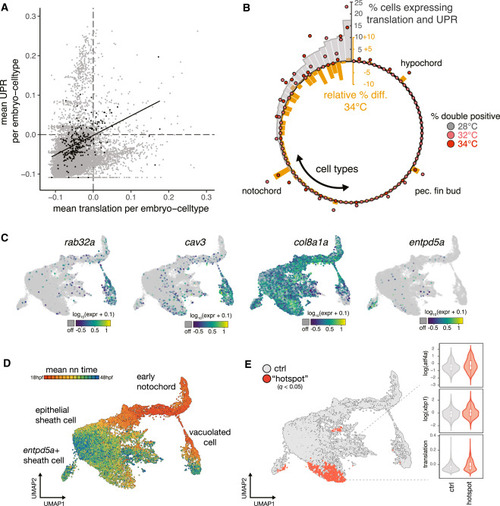
Exceptional regulation of the UPR underlies temperature sensitivity in the notochord (A) Scatterplot showing levels of translation signature and UPR signature across all embryo cell types. Consistent with known translational attenuation by UPR, these processes are generally uncorrelated across cell types. The notochord (plotted as black dots) is an exception, with a positive correlation (Pearson’s r = 0.51) between these processes and appreciable levels of both UPR and translation in a subset of embryos. (B) Circular bar plot showing occurrence of translation + UPR co-expression, displayed as percentage of double positive in each cell type (gray bars). Overlaid dots show raw percentage of double-positive cells for embryos raised at elevated temperature, colored pink and dark red for 32°C and 34°C, respectively. Orange bars show the relative change in the fraction of double-positive cells in each cell type at elevated temperatures. For the large majority of cell types, this difference is negative. The notochord, hypochord, and pectoral fin bud are the sole exceptions, where double-positive cells increase in response to temperature increase. (C) Marker gene plots showing expression of genes defining notochord subtypes (rab32a and cav3 in vacuolated cells; col8a1a in sheath cells; entpd5a in pre-mineralization sheath cells). (D) UMAP showing co-embedded notochord cells from reference and temperature perturbation experiment, colored according to the mean time point label of nearest neighbors in the reference. Annotations for each cell type are indicated. (E) UMAP showing sheath cells from temperature perturbation experiment with significant spatial bias using hotspot test (q < 0.05) in UMAP space (see STAR Methods). Cells with a significant spatial base are shown in red. Inset shows levels of UPR markers and translation signature in these cells increasing with temperature. |
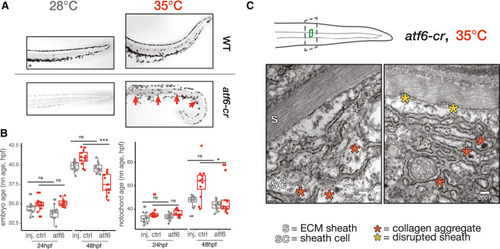
Loss of Atf6 limits temperature-induced acceleration of developmental rate and increases temperature sensitivity of the notochord (A) Images of Alcian blue-stained notochords (camera image in black and white) in the tails of wild-type and atf6 crispant embryos raised at 28°C and 35°C. Examples of notochord defects in crispants raised at elevated temperature, kinks indicated with red arrows (phenylthiourea was used for imaging 28°C crispants). (B) Box plots showing reduced capacity for acceleration of development at 34°C for the entire embryo (left) and notochord (right), while no developmental delay is apparent at 28°C. (C) Results of TEM of notochord sheath cells in atf6 crispants raised at elevated temperature, showing disrupted ER structure and aggregated collagen fibrils (red asterisks). Scale bar, 200 nm; sc, sheath cell; s, sheath. |
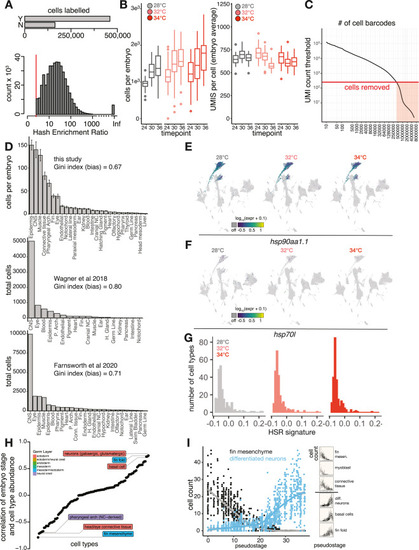
Individual-level capture of high-quality single-cell transcriptomes, related to Figure 1 (A) Bar plot showing the number of individual cells that pass (Y, yes; N, no) a hash enrichment ratio (count of most abundant hash relative to second-most abundant) threshold of 3. Below is a histogram showing the full distribution of hash enrichment ratios; cells where all reads were derived from a single hash are labeled as “Inf.” (B) Box plots showing the number of cells in each embryo (left) and number of UMIs per cell in each embryo (right), faceted by sample time point and colored by temperature treatment. (C) Knee plot showing the threshold for UMI count (red line) in called cells. (D) Bar plots showing tissue compositions as per-embryo cell counts in two additional single-cell RNA-seq studies of zebrafish whole-embryo samples. A measure of composition bias (Gini index) is listed above each bar chart; higher values indicate higher bias in tissue recovery or less even coverage across tissues. (E) Marker plot showing no induction of hsp90aa1.1 at 32°C or 34°C, including cells from all time points. (F) Marker plot for hsp70L, a gene used for transgenic reporters of heat shock in zebrafish, shown as in (E). (G) Histogram showing no systemic activation of the HSR across cell types at any of the temperatures profiled. While the total number of cell types with negligible HSR levels increases with temperature, nearly all cell types should have HSR signature values greater than 0 in the event of global activation of the HSR. (H) Dot plot of each cell type, ordered by the Pearson correlation between that cell type’s abundance and the whole-embryo pseudostage. Bellwether cell types with the highest correlations are labeled, with colors indicating tissue of origin. (I) Two examples from the highly correlated types shown in (A), with raw cell-type abundance data plotted against embryo stage for a strong negatively correlated type (fin mesenchyme) and strong positively correlated type (differentiated neurons); inset at right shows additional examples. |
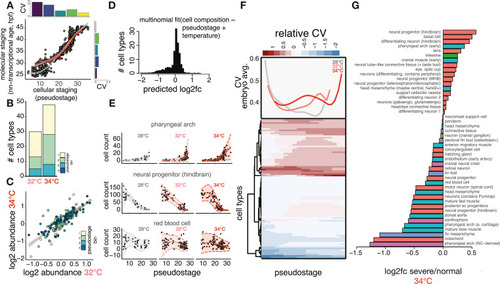
Temperature increases variability in specific cell types and stages of development, related to Figure 2 (A) Scatterplot comparing whole-embryo staging determined by either cell composition (x axis) or transcriptional data (y axis); inset bar plots show CV for each metric in groups of embryos sampled at various time points (time points in hpf indicated in gray text above each bar). Loess fit lines are shown for embryos raised at each temperature: 28°C (gray), 32°C (pink), and 34°C (red). (B) Stacked bar chart showing how the number of cell types with significant abundance changes increases with temperature; this phenomenon held for all pseudostage bins (in color) except bin 4, which lacked sufficient control embryos to analyze statistically. (C) Scatterplot showing positive relationship of log2 fold change in abundances in both elevated temperatures, colored as in (A). (D) Histogram showing changes in cell composition resulting from 34°C treatment, as predicted by multinomial model. (E) Scatterplots showing raw data (black points) and model outputs of mean (solid line) and variability (ribbons with dotted line) for three temperature-sensitive cell types. (F) Heatmap of each cell type showing relative increases in observed variability compared with variability expected during wild-type development through developmental time (pseudostage bins); shades of red indicate increased variability, while white to blue shades show neutral or decreased variability. The upper panel shows the average CVs for each temperature across all stages, highlighting pseudostages with increased variability at higher temperatures. (G) Bar plot showing the log2 fold change in abundance for all cell types in 34°C embryos with severe phenotypes relative to those that were phenotypically normal |
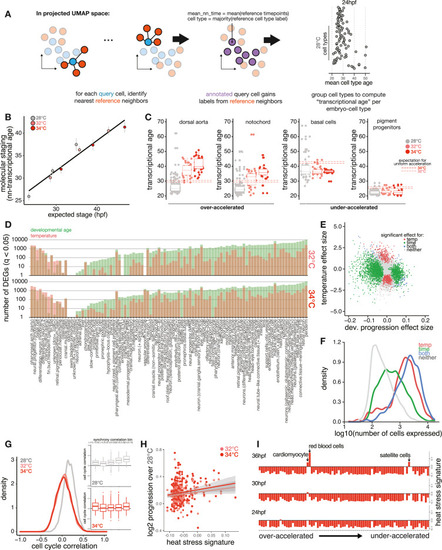
Temperature accelerates development non-uniformly across cell types, related to Figure 3 (A) Schematic showing method for computing transcriptional age of each cell through nearest-neighbor averaging of time point labels in the reference. (B) Scatterplot as in Figure 2B but showing how well whole-embryo staging by transcriptional data (nn-transcriptional age), rather than cell composition, predicts temperature-induced developmental acceleration. (C) Boxplots showing individual examples of cell types with greater-than-expected acceleration (left) and less-than-expected acceleration (right), with whole embryo expectation from Kimmel et al.24 for each temperature shown as dotted lines. (D) Bar plots showing the number of significantly (q < 0.05) differentially expressed genes in each cell type, separated by whether the gene has a significant association for developmental age (green) or temperature (red). Cell types along the x axis are ordered by the difference between the number of significant temperature genes vs. significant developmental age genes; the large majority shows more genes changing with developmental age rather than temperature. (E) Scatterplot showing significant genes separated by developmental age and temperature effects for a specific cell type, the notochord. Temperature and age coefficients are shown for each gene and are colored based on significant associations with each factor, neither, or both. (F) Density histogram showing that genes with significant associations with temperature tended to show higher expression levels than developmental age genes. (G) Density histogram of pairwise Pearson correlations for cell-cycle signature values across all cell-type pairs, with separate densities for each temperature. Inset shows boxplots of pairwise cell-cycle correlations grouped into cell-type pairs that showed lower or higher levels of developmental timing synchrony. (H) Scatterplot, as in Figure 3C, showing that the basal level of HSR signature in each cell type is not a strong predictor of that cell type’s developmental acceleration at 32°C or 34°C. (I) Bar plots showing the level of HSR signature induction for all cell types at 34°C; cell types on the y axis are ordered by relative developmental acceleration, with the most strongly accelerated types at the top, and columns for each time point. No induction of HSR signature is apparent in the most accelerated cell types. |
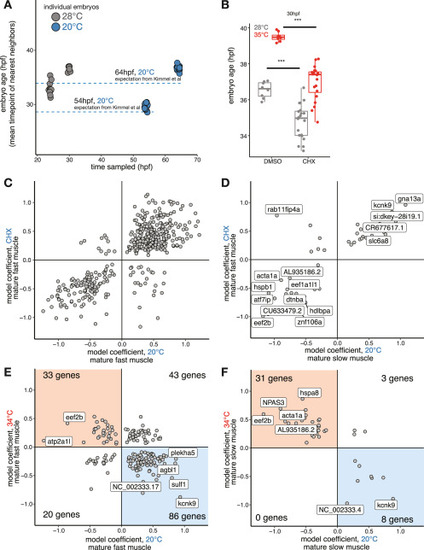
Cold treatment slows development and reveals cell-type-specific temperature-responsive genes in the normal range of zebrafish development, related to Figure 3 (A) Dot plot showing the sampling timing for cold-treated embryos (x axis is clock time), as well as their predicted whole-embryo stage based on integration with the 28°C reference data; the predicted stage roughly matched the expectation of the Kimmel et al.24 (B) Boxplot showing the effect of 5 μM CHX on temperature-induced acceleration of whole-embryo stage; developmental delay is evident in CHX-treated embryos raised at 28°C, and this effect is not overridden by 34°C temperature treatment. (C) Scatterplot showing temperature-dependent activation of genes of the fast muscle, expressed as model coefficients for each temperature after accounting for developmental stage. Most genes showed either heat-induced increases and cold-induced decreases in expression (red box in upper left) or heat-induced decreases and cold-induced increases in expression (blue box in lower left). (D) Scatterplot as in (C), but for slow muscle. € Scatterplot for fast muscle similar to (B) but showing cold vs. CHX treatment, which shows an overall strong positive correlation with gene expression similarly affected by both sources of developmental delay. (F) Scatterplot as €(E), but for slow muscle. |

Transcriptional responses to elevated temperature tend to be cell-type-specific, revealing burdens on proteostasis in the notochord, related to Figure 4 (A) UMAP of all genes with significant temperature-dependent transcriptional changes (see STAR Methods). Each point represents an individual gene, and genes with similar responses (coefficient in differential expression model after accounting for stage) across cell types are grouped together. Each cluster is labeled with a different color, and a representative Gene Ontology (GO) term for the group of genes in each cluster is indicated. Clusters in which gene groups returned no significant GO terms are labeled “NA.” (B) Heatmap of expression levels for each gene module in (A) as an average for each cell type at elevated temperatures. Consistent with the heterogeneous grouping of temperature responses in (A), elevated module expression tends to be cell-type specific (examples boxed). Module 5, which contains genes related to translation and ER processing, has the broadest response across cell types, but the magnitude of the response is greatest within the notochord. (C) Scatterplot showing levels of UPR signature in the notochord cells of all individual embryos, colored by temperature. Embryos raised at higher temperature show higher levels of UPR signature at nearly all profiled stages. Lines and ribbons are derived from LOESS fits across pseudostage. (D) Boxplot showing marked reduction of notochord cells in embryos raised at high temperature, with raw counts in control and temperature-treated embryos shown as poi€. (E) Boxplot showing the effect of the UPR inhibitor ISRIB on whole-embryo stage at 28°C and 34°C; embryos treated with ISRIB showed significant increases over expected temperature-induced acceleration at 24 hpf, but this effect was not evident in 48 hpf embryos. (F) Hotspot analysis, as in Figure 4D, showing enriched transcriptional state of notochord sheath cells in embryos treated with ISRIB; note that ISRIB-treated cells do not occupy the high-temperature state identified in wild-type embryos. (G) TEM of sheath cells in wild-type and atf6 crispants showing effects in both untreated and temperature-treated embryos. ER structure is perturbed in atf6 crispants, and severe sheath defects are visible in the temperature-treated atf6 crispants. Scale bar, 200 nm. |
Reprinted from Cell, 186, Dorrity, M.W., Saunders, L.M., Duran, M., Srivatsan, S.R., Barkan, E., Jackson, D.L., Sattler, S.M., Ewing, B., Queitsch, C., Shendure, J., Raible, D.W., Kimelman, D., Trapnell, C., Proteostasis governs differential temperature sensitivity across embryonic cell types, 50155027.e125015-5027.e12, Copyright (2023) with permission from Elsevier. Full text @ Cell