
|
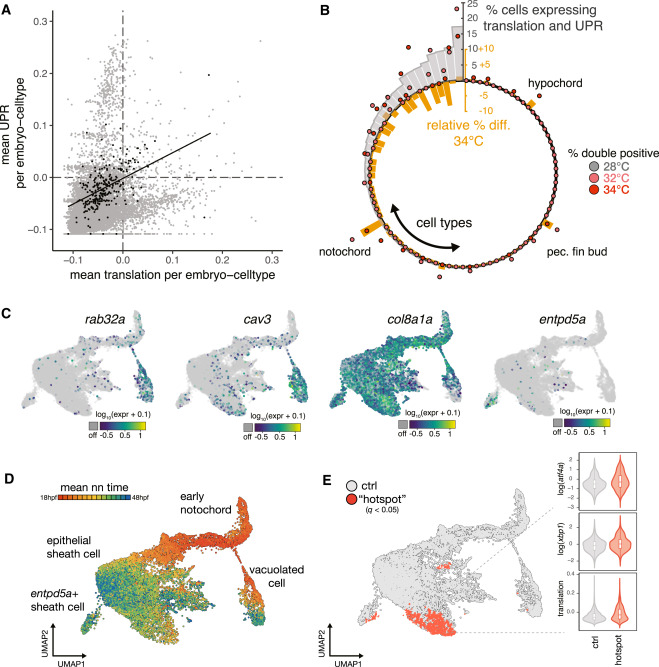
Fig. 4 Exceptional regulation of the UPR underlies temperature sensitivity in the notochord (A) Scatterplot showing levels of translation signature and UPR signature across all embryo cell types. Consistent with known translational attenuation by UPR, these processes are generally uncorrelated across cell types. The notochord (plotted as black dots) is an exception, with a positive correlation (Pearson’s r = 0.51) between these processes and appreciable levels of both UPR and translation in a subset of embryos. (B) Circular bar plot showing occurrence of translation + UPR co-expression, displayed as percentage of double positive in each cell type (gray bars). Overlaid dots show raw percentage of double-positive cells for embryos raised at elevated temperature, colored pink and dark red for 32°C and 34°C, respectively. Orange bars show the relative change in the fraction of double-positive cells in each cell type at elevated temperatures. For the large majority of cell types, this difference is negative. The notochord, hypochord, and pectoral fin bud are the sole exceptions, where double-positive cells increase in response to temperature increase. (C) Marker gene plots showing expression of genes defining notochord subtypes (rab32a and cav3 in vacuolated cells; col8a1a in sheath cells; entpd5a in pre-mineralization sheath cells). (D) UMAP showing co-embedded notochord cells from reference and temperature perturbation experiment, colored according to the mean time point label of nearest neighbors in the reference. Annotations for each cell type are indicated. (E) UMAP showing sheath cells from temperature perturbation experiment with significant spatial bias using hotspot test (q < 0.05) in UMAP space (see STAR Methods). Cells with a significant spatial base are shown in red. Inset shows levels of UPR markers and translation signature in these cells increasing with temperature.
Reprinted from Cell, 186, Dorrity, M.W., Saunders, L.M., Duran, M., Srivatsan, S.R., Barkan, E., Jackson, D.L., Sattler, S.M., Ewing, B., Queitsch, C., Shendure, J., Raible, D.W., Kimelman, D., Trapnell, C., Proteostasis governs differential temperature sensitivity across embryonic cell types, 50155027.e125015-5027.e12, Copyright (2023) with permission from Elsevier. Full text @ Cell