
Fig. s1
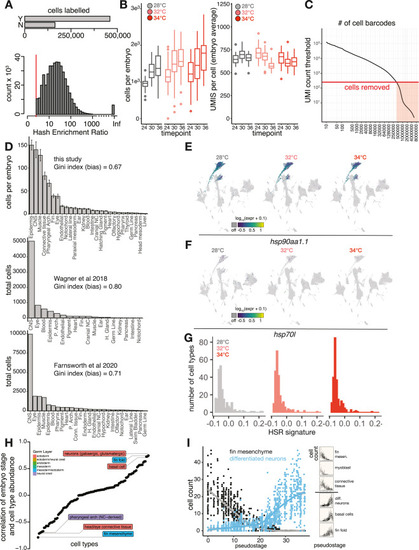
Individual-level capture of high-quality single-cell transcriptomes, related to Figure 1 (A) Bar plot showing the number of individual cells that pass (Y, yes; N, no) a hash enrichment ratio (count of most abundant hash relative to second-most abundant) threshold of 3. Below is a histogram showing the full distribution of hash enrichment ratios; cells where all reads were derived from a single hash are labeled as “Inf.” (B) Box plots showing the number of cells in each embryo (left) and number of UMIs per cell in each embryo (right), faceted by sample time point and colored by temperature treatment. (C) Knee plot showing the threshold for UMI count (red line) in called cells. (D) Bar plots showing tissue compositions as per-embryo cell counts in two additional single-cell RNA-seq studies of zebrafish whole-embryo samples. A measure of composition bias (Gini index) is listed above each bar chart; higher values indicate higher bias in tissue recovery or less even coverage across tissues. (E) Marker plot showing no induction of hsp90aa1.1 at 32°C or 34°C, including cells from all time points. (F) Marker plot for hsp70L, a gene used for transgenic reporters of heat shock in zebrafish, shown as in (E). (G) Histogram showing no systemic activation of the HSR across cell types at any of the temperatures profiled. While the total number of cell types with negligible HSR levels increases with temperature, nearly all cell types should have HSR signature values greater than 0 in the event of global activation of the HSR. (H) Dot plot of each cell type, ordered by the Pearson correlation between that cell type’s abundance and the whole-embryo pseudostage. Bellwether cell types with the highest correlations are labeled, with colors indicating tissue of origin. (I) Two examples from the highly correlated types shown in (A), with raw cell-type abundance data plotted against embryo stage for a strong negatively correlated type (fin mesenchyme) and strong positively correlated type (differentiated neurons); inset at right shows additional examples. |
Reprinted from Cell, 186, Dorrity, M.W., Saunders, L.M., Duran, M., Srivatsan, S.R., Barkan, E., Jackson, D.L., Sattler, S.M., Ewing, B., Queitsch, C., Shendure, J., Raible, D.W., Kimelman, D., Trapnell, C., Proteostasis governs differential temperature sensitivity across embryonic cell types, 50155027.e125015-5027.e12, Copyright (2023) with permission from Elsevier. Full text @ Cell