
- Title
-
Conserved enhancers control notochord expression of vertebrate Brachyury
- Authors
- Kemmler, C.L., Smolikova, J., Moran, H.R., Mannion, B.J., Knapp, D., Lim, F., Czarkwiani, A., Hermosilla Aguayo, V., Rapp, V., Fitch, O.E., Bötschi, S., Selleri, L., Farley, E., Braasch, I., Yun, M., Visel, A., Osterwalder, M., Mosimann, C., Kozmik, Z., Burger, A.
- Source
- Full text @ Nat. Commun.
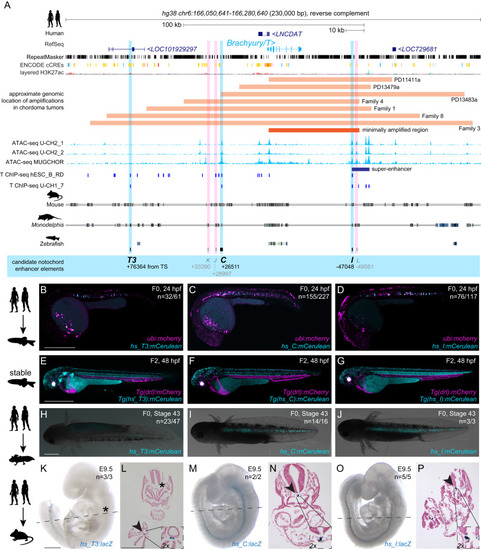
Human |
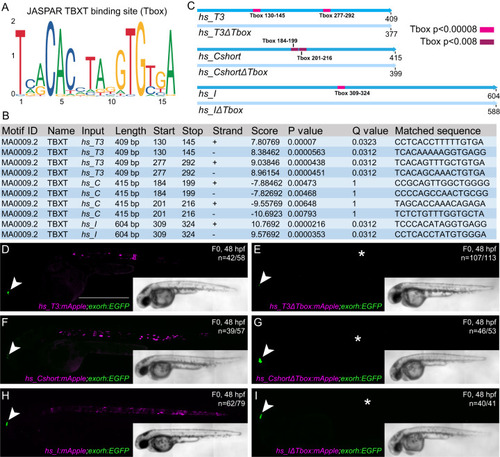
Identified TBXT binding sites in the enhancer elements are essential for reporter activity. |
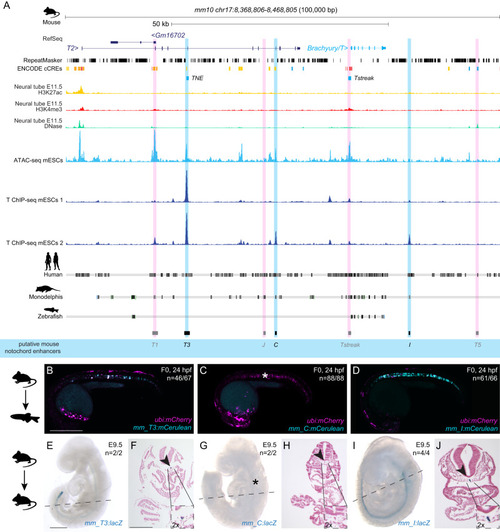
Mouse |
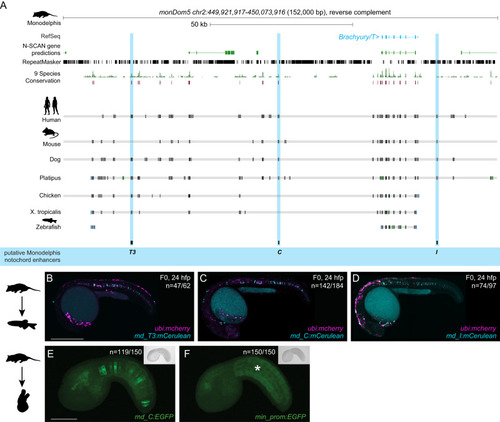
Monodelphis |
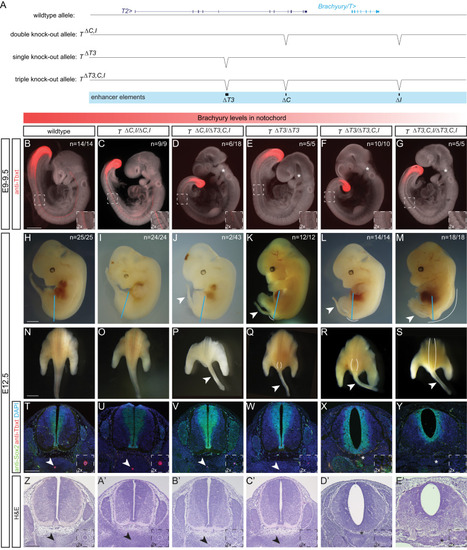
Deletion of the three enhancer elements |
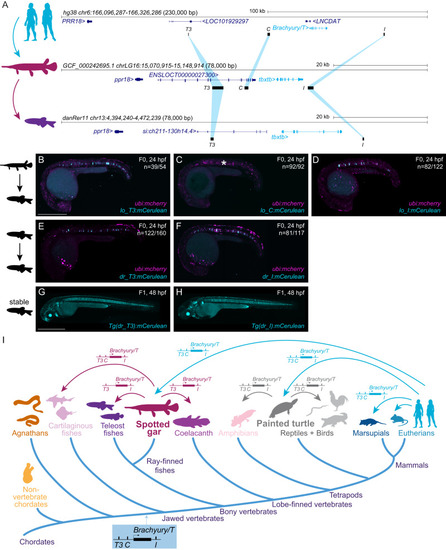
Bridge species establish the presence of |