|
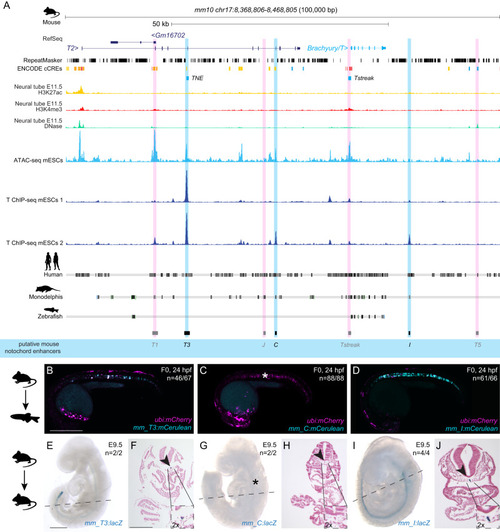
Mouse Brachyury enhancer elements are active in different species. A Mouse Brachyury/T/TBXTB locus adapted from the UCSC genome browser. Repeats marked in black using the RepeatMasker track; additional tracks include the ENCODE cCREs, H3K27ac (yellow), H3K4me (red) and DNase (green) signals. ATAC-sequencing (light blue peaks) and T ChIP-sequencing (dark blue lines) indicate enhancer elements (light pink highlight, not active; light blue highlight, active) that are conserved in human and Monodelphis. B–D Representative F0 zebrafish embryos injected with the mouse enhancer elements mm_T3 (B), mm_C (C), and mm_I (D). mm_T3 and mm_I show mosaic mCerulean reporter expression in the notochord at 24 hpf and mosaic ubi:mCherry expression as injection control. Mouse enhancer element mm_C is not active in the zebrafish notochord (asterisk in C). N represent the number of animals expressing mCerulean in the notochord relative to the total number of animals expressing mCherry. Scale bar in (B): 0.5 mm, applies to (B–D). E, G, I Representative images of transgenic E9.5 mouse embryos expressing lacZ (encoding beta-galactosidase) under the mouse enhancer elements mm_T3 (E), mm_C (G) and mm_I (I) visualized with X-gal whole mount staining. While mm_T3 and mm_I express beta-galactosidase in the entire notochord, beta-galactosidase expression from mouse mm_C is absent (asterisk in G). N represent the number of animals expressing beta-galactosidase in the notochord relative to the total number of animals with tandem integrations at H11. Dotted lines represent the sectioning plane. Scale bar in (E): 0.5 mm, applies to E, G, I. F, H, J Representative images of Fast Red-stained cross sections from embryos shown on the left, mm_T3 (F), mm_C (H), and mm_I (J). Black arrowheads point at notochord, and inserts show notochords at 2x higher magnification. Scale bar in F: 0.25 mm, applies to F, H, J. The species silhouettes were adapted from the PhyloPic database (www.phylopic.org).
|