|
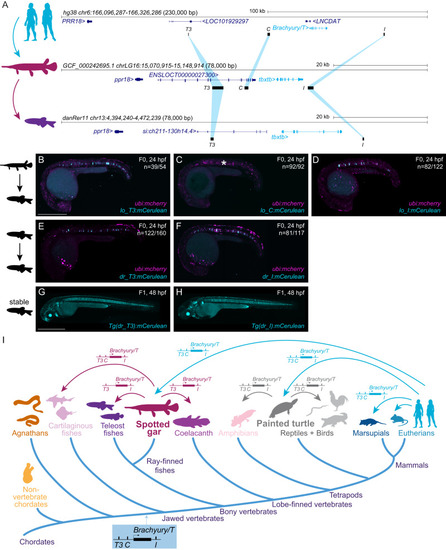
Bridge species establish the presence of Tbxtb enhancers across jawed vertebrates. A Location of the enhancer elements in the human (top), gar (middle), and zebrafish (bottom) Brachyury/T/Tbxtb loci, adapted from the UCSC browser as established through the “gar bridge”. B–D Representative F0 zebrafish embryos injected with the gar enhancer elements Io_T3 (B), Io_C (C), and Io_I (D). T3 and I show mosaic mCerulean reporter expression in the notochord at 24 hpf compared to gar element C with is not active in the zebrafish notochord (asterisk). N represent the number of animals expressing mCerulean in the notochord relative to the total number of animals expressing mosaic ubi:mCherry as injection control. Scale bar in (B): 0.5 mm, applies to (B–F). E, F Representative F0 zebrafish embryos injected with the conserved zebrafish enhancer elements dr_T3 (E) and dr_I (F). T3 and I show mosaic mCerulean reporter expression in the notochord at 24 hpf. N represent the number of animals expressing mCerulean in the notochord relative to the total number of animals expressing mosaic ubi:mCherry as injection control. G, H Representative images of stable F1 embryos at 2 dpf of zebrafish enhancer elements T3 and I recapitulate the F0 expression pattern in the notochord, with dr_T3 (E) additionally expressing mCerulean in the brain, heart, and fin, and dr_I (G) in the proximal kidney close to the anal pore, pharyngeal arches, heart, fin, and spinal cord neurons. Scale bar in (G): 0.5 mm, applies to (G, H). I Phylogenetic representation of species investigated using the bridging approach with spotted gar and painted turtle as anchor species within ray-finned fish and tetrapod lineages. Arrows indicate informative phylogenetic comparisons to uncover conservation of enhancer elements T3, I, and C. The species silhouettes were adapted from the PhyloPic database (www.phylopic.org).
|