FIGURE SUMMARY
Title

Apollo-NADP+ reveals in vivo adaptation of NADPH/NADP+ metabolism in electrically activated pancreatic β cells

Authors
Bui, C.V., Boswell, C.W., Ciruna, B., Rocheleau, J.V.
Source
Full text @ Sci Adv

In vivo imaging of fluorescence anisotropy controls expressed in pancreatic β cells of 5-dpf zebrafish embryos.

(A) Top: Tol2 transposon constructs used to express two fluorescence anisotropy controls, R198P and TDimer, in zebrafish. Expression is targeted to β cells using a zebrafish insulin promoter. Bottom: The R198P and TDimer establish the upper and lower bounds, respectively, of the Apollo-NADP+ dynamic range. pA, polyadenylation signal. (B) Transgenic zebrafish embryo at 5 dpf, imaged from the right lateral view. White arrow indicates the pancreatic islet. (C) Schematic of microfluidic device and features used to hold zebrafish embryos during imaging. (D) Schematic of microfluidic device cross section and perfusion flow through the device. PDMS, polydimethylsiloxane. (E) In vivo pancreatic islet slice images from 5-dpf R198P (top) and TDimer (bottom) transgenic zebrafish embryos, taken at various depths (5 to 40 μm). (F) In vivo fluorescence anisotropy imaging of 5-dpf islets of R198P and TDimer transgenic zebrafish embryos, taken at 1-μm intervals. n = 25 to 27 embryos. (G) In vivo time series fluorescence anisotropy imaging of a single islet slice from 5-dpf R198P and TDimer transgenic zebrafish embryos, taken at 10-s intervals. n = 13 to 15 embryos.

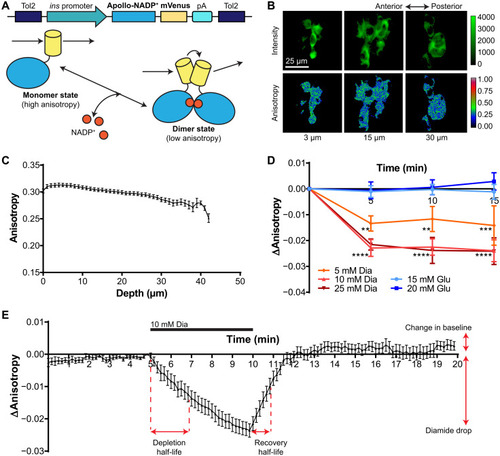
In vivo imaging of mVenus-tagged Apollo-NADP+ expressed in pancreatic β cells of 5-dpf zebrafish embryos.

(A) Top: Tol2 transposon construct used to express Apollo-NADP+ in zebrafish. Expression is targeted to β cells using a zebrafish insulin promoter. Bottom: Apollo-NADP+ switches between a monomer and homodimeric state in response to changes in NADP+ concentration. (B) In vivo pancreatic islet slice images from 5-dpf Apollo-NADP+ transgenic zebrafish embryos, taken at 3-, 15-, and 30-μm depths. (C) In vivo fluorescence anisotropy imaging of 5-dpf islets of Apollo-NADP+ zebrafish embryos, taken at 1-μm intervals. n = 26 embryos. (D) In vivo time series fluorescence anisotropy imaging of 5-dpf islets of Apollo-NADP+ transgenic zebrafish in response to treatment with glucose (Glu) or diamide (Dia), taken at 5-min intervals. n = 8 to 15 embryos; **P < 0.01 and ****P < 0.0001. (E) In vivo time series fluorescence anisotropy imaging of a single islet slice from 5-dpf Apollo-NADP+ transgenic zebrafish embryos, taken at 10-s intervals. Diamide (10 mM) was added at 5 min and removed at 10 min. n = 15 embryos.

Selective inhibition of NADP+ reduction pathways in unstressed and stressed pancreatic β cells of 5-dpf zebrafish embryos.

(A) Diagram of NADP+ reduction pathways, indicated with blue shading, and associated chemical inhibitors, indicated with red text. Connected pathways are indicated with green shading, and mitochondria are indicated with pink shading. (B) NADPH recovery half-life after diamide removal, quantified from in vivo time series fluorescence anisotropy imaging of islet slices from 5-dpf Apollo-NADP+ transgenic zebrafish embryos. UK (200 μM) was used to inhibit pyruvate cycling, 6AN (50 μM) was used to inhibit pentose phosphate pathway, and MTX (50 μM) was used to inhibit folate cycling. Chemical inhibitors were added 1 hour before imaging. (C) Change in baseline anisotropy, quantified from in vivo time series fluorescence anisotropy imaging of islet slices from 5-dpf Apollo-NADP+ transgenic zebrafish embryos. (D) NADPH recovery half-life after diamide removal, quantified from in vivo time series fluorescence anisotropy imaging of islet slices from 5-dpf Apollo-NADP+ transgenic zebrafish embryos. Stress was induced by 8 hours of treatment with 20 μM GLB. (E) Change in baseline anisotropy, quantified from in vivo time series fluorescence anisotropy imaging of islet slices from 5-dpf Apollo-NADP+ transgenic zebrafish embryos. n = 10 to 15 embryos. *P < 0.05, **P < 0.01, ***P < 0.001, and ****P < 0.0001.

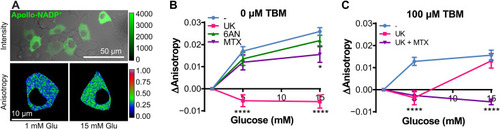
Selective inhibition of NADP+ reduction pathways in unstressed and stressed INS1E pancreatic β cells.

(A) INS1E β cells transfected with Apollo-NADP+. Top: Fluorescence intensity image of Apollo-NADP+ expressed in INS1E β cells. Bottom: Fluorescence anisotropy images of Apollo-NADP+ expressing INS1E β cells stimulated with glucose. (B) Glucose-stimulated NADP+ reduction of INS1E β cells transfected with Apollo-NADP+. UK (50 μM) was used to inhibit pyruvate cycling, 6AN (5 μM) was used to inhibit the pentose phosphate pathway, and MTX (5 μM) was used to inhibit folate cycling. Chemical inhibitors were added 1 hour before imaging. (C) Glucose-stimulated NADP+ reduction of INS1E β cells transfected with Apollo-NADP+. Stress was induced by 8 hours of stress treatment with 100 μM TBM. n = 3 to 6 replicates. *P < 0.05 and ****P < 0.0001.

Investigating potential mechanisms of folate cycle activation during chronic stress in INS1E β cells.

(A) Diagram showing sources of NAD+ and serine for folate cycling activation. ADP, adenosine 5′-diphosphate; ATP, adenosine 5′-triphosphate; TCA, tricarboxylic acid; SHMT1, serine hydroxymethyltransferase 1; CH2-THF, 5,10-methylenetetrahydrofolate; P-pyruvate, 3-phosphohydroxypyruvate; P-serine, 3-phosphoserine. (B) Glucose stimulation of INS1E β cells transfected with Apollo-NADP+. Cells were treated with 100 μM NMN for 24 hours to elevate NAD+ levels. UK (50 μM) was added 1 hour before imaging to block NADP+ reduction by pyruvate cycling. (C) Carbonyl cyanide p-trifluoromethoxyphenylhydrazone (FCCP; 1 μM) stimulation of INS1E β cells transfected with Apollo-NADP+ at 1 or 15 mM glucose. UK (50 μM) was added 1 hour before imaging to block pyruvate cycling. (D) Serine stimulation (0.3 mM) of unstressed (0 μM TBM) and stressed (8 hours of 100 μM TBM) INS1E β cells transfected with Apollo-NADP+. Cells were pretreated with 1 mM asparagine for 1 hour before imaging to promote extracellular serine uptake. Imaging was done at low glucose (1 mM) to avoid activation of pyruvate cycling. (E) Serine stimulation (0.3 mM) of INS1E β cells transfected with Apollo-NADP+. Cells were treated with 100 μM NMN for 24 hours to elevate NAD+ levels or treated with both 100 μM NMN and 5 μM MTX for 24 hours to block NAD+ conversion to NADP+. One hour before imaging, cells were pretreated with 1 mM asparagine to promote extracellular serine uptake. Imaging was done at low glucose (1 mM) to avoid activation of pyruvate cycling. (F) Simplified diagram of potential factors required to trigger NADP+ reduction through folate cycling. n = 3 to 6 replicates. *P < 0.05, **P < 0.01, and ***P < 0.001.

Acknowledgments
This image is the copyrighted work of the attributed author or publisher, and ZFIN has permission only to display this image to its users. Additional permissions should be obtained from the applicable author or publisher of the image. Full text @ Sci Adv