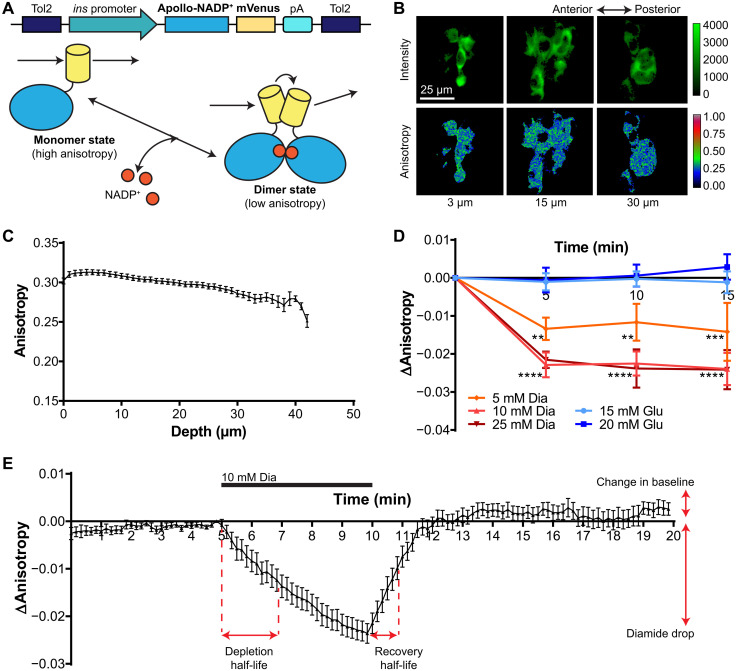
Fig. 2.
In vivo imaging of mVenus-tagged Apollo-NADP+ expressed in pancreatic β cells of 5-dpf zebrafish embryos.
(A) Top: Tol2 transposon construct used to express Apollo-NADP+ in zebrafish. Expression is targeted to β cells using a zebrafish insulin promoter. Bottom: Apollo-NADP+ switches between a monomer and homodimeric state in response to changes in NADP+ concentration. (B) In vivo pancreatic islet slice images from 5-dpf Apollo-NADP+ transgenic zebrafish embryos, taken at 3-, 15-, and 30-μm depths. (C) In vivo fluorescence anisotropy imaging of 5-dpf islets of Apollo-NADP+ zebrafish embryos, taken at 1-μm intervals. n = 26 embryos. (D) In vivo time series fluorescence anisotropy imaging of 5-dpf islets of Apollo-NADP+ transgenic zebrafish in response to treatment with glucose (Glu) or diamide (Dia), taken at 5-min intervals. n = 8 to 15 embryos; **P < 0.01 and ****P < 0.0001. (E) In vivo time series fluorescence anisotropy imaging of a single islet slice from 5-dpf Apollo-NADP+ transgenic zebrafish embryos, taken at 10-s intervals. Diamide (10 mM) was added at 5 min and removed at 10 min. n = 15 embryos.
Acknowledgments
This image is the copyrighted work of the attributed author or publisher, and
ZFIN has permission only to display this image to its users.
Additional permissions should be obtained from the applicable author or publisher of the image.
Full text @ Sci Adv
Your Input Welcome
Thank you for submitting comments. Your input has been emailed to ZFIN curators who may contact you if
additional information is required.
Oops. Something went wrong. Please try again later.