FIGURE

Fig. 2.

ID
ZDB-FIG-231007-2
Publication
Bui et al., 2023 - Apollo-NADP+ reveals in vivo adaptation of NADPH/NADP+ metabolism in electrically activated pancreatic β cells
Other Figures
All Figure Page
Back to All Figure Page
Fig. 2.

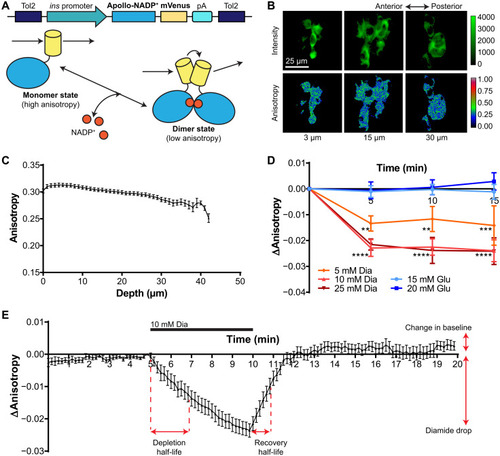
In vivo imaging of mVenus-tagged Apollo-NADP+ expressed in pancreatic β cells of 5-dpf zebrafish embryos.

(A) Top: Tol2 transposon construct used to express Apollo-NADP+ in zebrafish. Expression is targeted to β cells using a zebrafish insulin promoter. Bottom: Apollo-NADP+ switches between a monomer and homodimeric state in response to changes in NADP+ concentration. (B) In vivo pancreatic islet slice images from 5-dpf Apollo-NADP+ transgenic zebrafish embryos, taken at 3-, 15-, and 30-μm depths. (C) In vivo fluorescence anisotropy imaging of 5-dpf islets of Apollo-NADP+ zebrafish embryos, taken at 1-μm intervals. n = 26 embryos. (D) In vivo time series fluorescence anisotropy imaging of 5-dpf islets of Apollo-NADP+ transgenic zebrafish in response to treatment with glucose (Glu) or diamide (Dia), taken at 5-min intervals. n = 8 to 15 embryos; **P < 0.01 and ****P < 0.0001. (E) In vivo time series fluorescence anisotropy imaging of a single islet slice from 5-dpf Apollo-NADP+ transgenic zebrafish embryos, taken at 10-s intervals. Diamide (10 mM) was added at 5 min and removed at 10 min. n = 15 embryos.

Expression Data

Expression Detail
Antibody Labeling
Phenotype Data

Phenotype Detail
Acknowledgments
This image is the copyrighted work of the attributed author or publisher, and ZFIN has permission only to display this image to its users. Additional permissions should be obtained from the applicable author or publisher of the image. Full text @ Sci Adv