
- Title
-
adgrl3.1-deficient zebrafish show noradrenaline-mediated externalizing behaviors, and altered expression of externalizing disorder-candidate genes, suggesting functional targets for treatment
- Authors
- Fontana, B.D., Reichmann, F., Tilley, C.A., Lavlou, P., Shkumatava, A., Alnassar, N., Hillman, C., Karlsson, K.Æ., Norton, W.H.J., Parker, M.O.
- Source
- Full text @ Transl Psychiatry
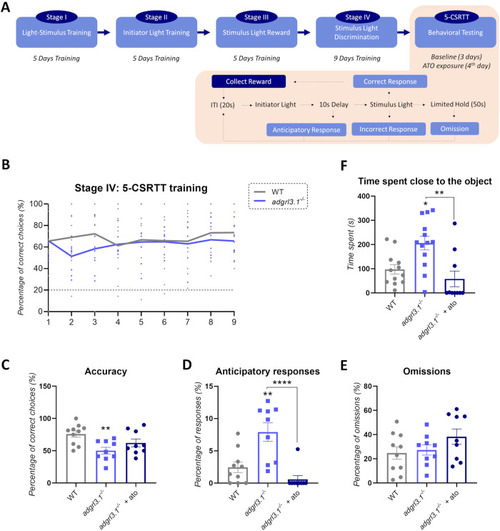
PHENOTYPE:
|
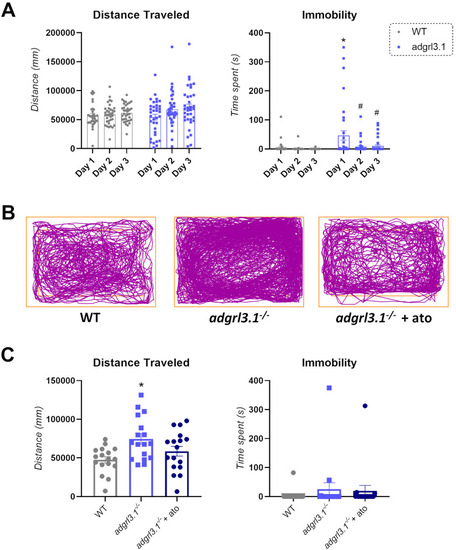
PHENOTYPE:
|
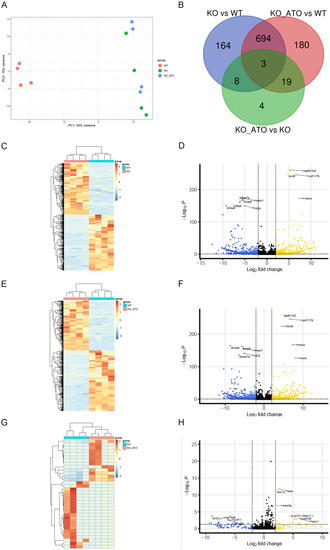
RNA-seq summary data. |