FIGURE

Fig. 3

ID
ZDB-FIG-231004-37
Publication
Fontana et al., 2023 - adgrl3.1-deficient zebrafish show noradrenaline-mediated externalizing behaviors, and altered expression of externalizing disorder-candidate genes, suggesting functional targets for treatment
Other Figures
All Figure Page
Back to All Figure Page
Fig. 3

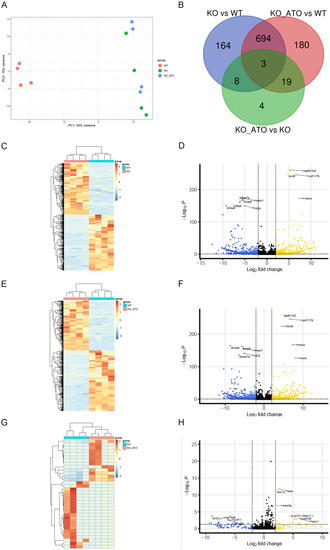
RNA-seq summary data.

A Principal component analysis plot of the top 200 most variable genes after differential expression analysis. n = 4 brains/group. B Venn diagram showing the overlap of differentially expressed genes (DEGs) between WT zebrafish, adgrl3.1−/− and adgrl3.1−/− treated with atomoxetine. C Heatmap of DEGs (lowest adjusted p value (padj) < 0.05 and LFC > |2 | ) between WT and adgrl3.1−/−. D Volcano plot displaying DEGs between WT and adgrl3.1−/−. DEGs with padj are highlighted. n = 4 per group. E Heatmap of DEGs (padj < 0.05 and LFC > |2 | ) between WT and adgrl3.1−/− treated with atomoxetine. F Volcano plot displaying DEGs between WT and adgrl3.1−/− treated with atomoxetine. DEGs with padj are highlighted. n = 4 per group. G Heatmap of DEGs (padj < 0.05 and LFC > |2 | ) between adgrl3.1−/− and adgrl3.1−/− treated with atomoxetine. H Volcano plot displaying DEGs between adgrl3.1−/− and adgrl3.1−/− treated with atomoxetine. DEGs with padj are highlighted. n = 4 per group.

Expression Data

Expression Detail
Antibody Labeling
Phenotype Data

Phenotype Detail
Acknowledgments
This image is the copyrighted work of the attributed author or publisher, and ZFIN has permission only to display this image to its users. Additional permissions should be obtained from the applicable author or publisher of the image. Full text @ Transl Psychiatry