FIGURE SUMMARY
Title

Cancer-associated fibroblasts influence Wnt/PCP signaling in gastric cancer cells by cytoneme-based dissemination of ROR2

Authors
Rogers, S., Zhang, C., Anagnostidis, V., Liddle, C., Fishel, M.L., Gielen, F., Scholpp, S.
Source
Full text @ Proc. Natl. Acad. Sci. USA

CAFs form extensive filopodial contacts with AGS cells and have up-regulated ROR2 expression on cytoneme tips. (A) pCAF cells (C) transfected with membrane GFP form an extensive and complex network of filopodia which engulf neighboring AGS cells (A) in 2D cell culture. The scale bar represents 10 µm. (B) primary gastric cancer–associated myofibroblasts (gCAM) (C) transfected with membrane GFP extend multiple filopodia in 3D culture that contact AGS cells (A) transfected with membrane mCherry, and transport multiple membrane-bound vesicles from producing to receiving cell (SI Appendix, Fig. S1A). The scale bar represents 10 µm. (C) mRNA levels of the indicated gene are shown as fold change away from AGS. Wnt5a is shown in red, with values on the left Y axis. ROR2 is shown in blue, with values on the right Y axis. gNM, primary gastric normal myofibroblasts; gCAM6, primary gastric cancer–associated myofibroblast patient 6; gCAM13, primary gastric cancer–associated myofibroblast patient 13; pCAF2, pancreatic CAF cell line 2. Values shown were calculated using the 2−ΔΔCt method and are plotted on a log10 scale. Comparison of 40-Ct values for all cells is shown in SI Appendix, Fig. S1 B and C. (D) Immunofluorescence on pCAF2 cells fixed using a previously described method to preserve filopodia. The left-hand column indicates WNT5A/B antibody staining, the center panel indicates ROR2 antibody staining, and the right-hand panel indicates WNT5A/B and ROR2 antibody staining (blue and red, respectively) merged with Phalloidin FITC shown in green. Three representative experiments are shown, and yellow arrowheads indicate WNT5A/ROR2 clusters. Antibody controls are shown in SI Appendix, Fig. S1 G and H. The scale bar represents 10 µm.

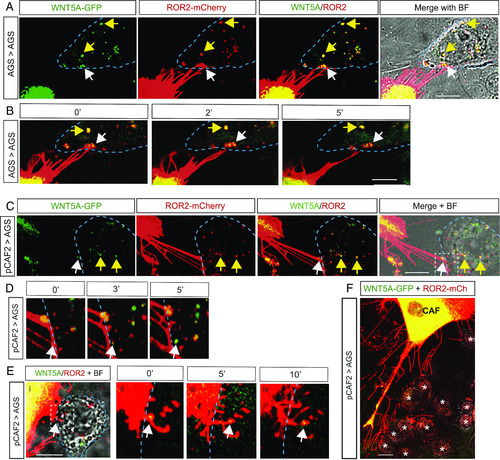
ROR2 and WNT5A complexes are transported from producing pCAF2 cells to receiving AGS cells. (A) AGS cell expresses ROR2-mCherry and WNT5A-GFP on cytoneme tips (white arrowhead), which can be seen contacting a neighboring AGS receiving cell identified in the BF image and indicated by the blue dashed line. Other ROR2/WNT5A complexes from the producing cell can be seen localizing in the receiving cell, as indicated by the yellow arrows. The scale bar represents 10 µm. (B) Time-lapse images, as indicated in minutes, show a ROR2/WNT5A complex (white arrowhead) leaving the cytoneme and colocalizing in the receiving cell shown in A. Other ROR2/WNT5A complexes from the producing cell can be seen continuing to colocalize in the receiving cell over time, as indicated by the yellow arrow. The scale bar represents 10 µm. (C) pCAF2 cell expresses ROR2-mCherry and WNT5A-GFP on cytoneme tips (white arrowhead), which can be seen contacting a neighboring AGS receiving cell identified in the BF image and indicated by the blue dashed line. Other ROR2/WNT5A complexes from the producing cell can be seen localizing in the receiving cell, as indicated by the yellow arrows. The scale bar represents 10 µm. (D) Time-lapse images, as indicated in minutes, of the area denoted by the white dashed box in C. A ROR2/WNT5A complex (white arrowhead) leaves the cytoneme and colocalizes in the receiving cell shown in C. (E) A further example of the transport of ROR2/WNT5A complexes from pCAF2-producing cells to AGS-receiving cells. Images as described for C and D. (E, iiiv) show the time-lapse images of the white boxed area in E, i. The scale bar represents 10 µm. (F) pCAF2 cell (C) transfected with ROR2 mCherry and WNT5A GFP transport complexes to receiving AGS cells (A) over a large distance. The scale bar represents 10 µm.

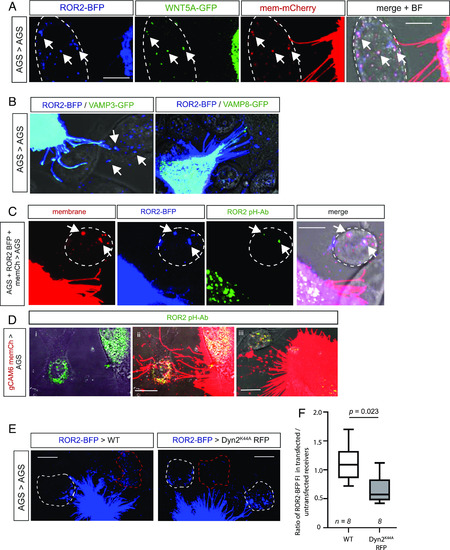
WNT5A/ROR2 complexes are endocytosed by receiving cells and exist in a conformation that enables signaling. (A) Confocal image of an AGS cell transiently transfected with ROR2-BFP, WNT5A-GFP, and membrane mCherry. ROR2/WNT5A/membrane marker complexes in a receiving, untransfected AGS cell, as determined by the bright-field (BF) image, are indicated by white arrowheads. The scale bar represents 10 µm. An orthogonal view is shown in SI Appendix, Fig. S3A. (B) AGS cells were transiently transfected with ROR2-BFP and either VAMP3-GFP or VAMP8-GFP and live imaged using confocal microscopy. The scale bar represents 10 µm (C) AGS cells transfected with membrane mCherry and ROR2-BFP were cocultured with untransfected AGS cells, incubated in anti-ROR2 antibody labeled with a pH-dependent GFP dye for 20 h, and live imaged by confocal microscopy. The scale bar represents 10 µm. (D) gCAM6 cells transfected with membrane mCherry were cocultured with AGS cells, incubated in anti-Ror2 antibody labeled with a pH-dependent GFP dye for 20 h, and live imaged by confocal microscopy. i) and ii) shows the same frame, iii) shows a second example. The scale bar represents 10 µm. (E) AGS cells were transiently transfected with ROR2-BFP and cocultured with AGS cells expressing either membrane mCherry or RFP Dyn2K44A for 24 h. Cells were live imaged using confocal microscopy. The amount of ROR2-BFP in transfected AGS (red dashed line) was quantified. Full images are shown in SI Appendix, Fig. S3D. The scale bar represents 10 µm. (F) The ratio of the amount of ROR2 in the transfected receiving cell compared to the untransfected receiving cell was calculated for control (membrane mCherry) and Dyn2K44A cells. Significance was determined using an unpaired Student t test.

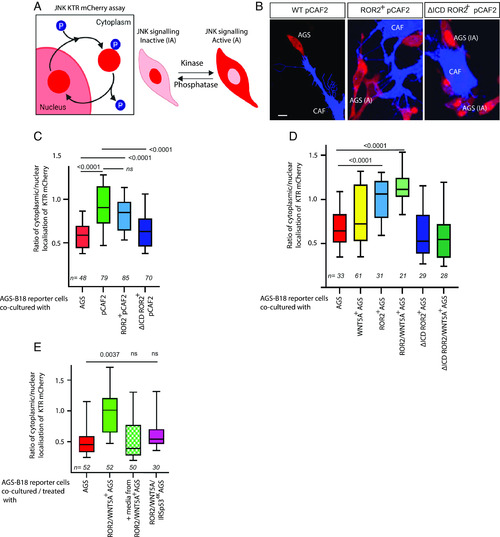
ROR2 induces JNK signaling in receiving AGS cells. (A) Schematic depicting the JNK signaling assay (adapted from ref. 25). Upon activation of the JNK signaling pathway, the mCherry reporter protein translocates from the nucleus to the cytoplasm of the cell. (B) Representative confocal images of AGS-B18 cells cocultured with wild-type pCAF2 transfected with either membrane GFP (Left), ROR2 BFP (Center), or dCD ROR2 BFP (Right). The scale bar represents 10 μm. (C) Quantification of the cytoplasmic to nuclear ratio of the JNK reporter signal in receiving AGS-B18 reporter cells cocultured with pCAF2 cells as described in (B). Reporter cells were cocultured with wild-type (WT) AGS cells as a control. Boxes represent 95% quartile, the centerline indicates the mean, and the whiskers indicate the range. n = number of receiving cells quantified. Results are from three independent experiments. Significance was calculated using an unpaired t test between two conditions. (D) Quantification of the cytoplasmic to the nuclear ratio of JNK reporter signal in AGS-B18 reporter cells cocultured with AGS cells transfected with either membrane GFP (WT AGS), ROR2, ROR2, and WNT5A, ROR2 lacking the cytoplasmic domain (dCD ROR2) or dCD ROR2plus WNT5A as indicated. n = number of receiving cells quantified. Results are from three independent experiments. Significance was calculated using an unpaired t test between two conditions. (E) Quantification of the cytoplasmic to nuclear ratio of JNK reporter signal in AGS-B18 reporter cells cocultured with AGS cells transfected with either membrane GFP (WT AGS), ROR2 and WNT5A, or ROR2, WNT5A, and dnIRSp534K to block cytoneme formation as indicated. AGS-B18 reporter cells were also cultured in media only taken from AGS cells transfected with ROR2 and WNT5A for 24 h as indicated by MEDIA. n = number of receiving cells quantified. Significance was calculated using an unpaired t test between each two conditions.

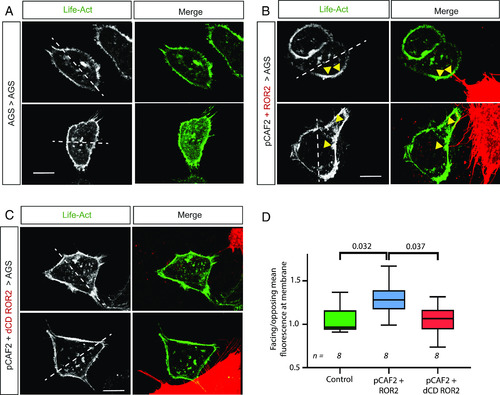
ROR2 induces actin polarization in receiving AGS cells. AGS cells were transfected with LifeAct GFP and cultured either (A) on their own (Control) or with pCAF2 cells overexpressing (B) ROR2 mCherry or (C) dCD ROR2 mCherry. Cells were imaged using confocal microscopy. The left-hand panel shows the 488-nm channel only (LifeAct-GFP), and the right-hand panel shows the merge of the green channel with the red channel to show the location of the producing cell and contact points. White dashed lines indicate a bisecting line through the center of the nucleus used to define the facing and opposing sides of the receiving cell. Yellow arrows indicate actin accumulation at contact points with ROR2-producing pCAF2 cells. The scale bar represents 10 μm. Two representative images from each condition are shown. (D) Quantification of facing/opposing mean fluorescent-labeled actin in receiving AGS cells in contact with cells as indicated on the X axis. n = number of receiving cells quantified. Significance was calculated using an unpaired t test between each two conditions.

ROR2 induces polarized migration and invasion in 3D models. (A) Schematic demonstrating the 3D invasion assay. AGS cells transiently transfected with membrane GFP are cultured in a monolayer in transwells with an 8-μm pore size. pCAF2 cells transfected with either membrane mCherry, ROR2 mCherry, or dCD ROR2 mCherry are cultured in 3D using GrowDex at the bottom of the well, ensuring contact is made between the GrowDex and the transwell (SI Appendix, Fig. S6D). The black arrow indicates the migratory direction from the GFP-positive AGS cells into the hydrogel containing mCherry labeled CAFs. Following incubation for 72 h, the GrowDex is imaged using fluorescent light microscopy. Invading GFP-positive AGS cells are identified digitally by Imaris based on their size (20 μm in x, y, and z) to exclude cell debris and converted to dots (SI Appendix, Fig. S6E). The distance of each AGS cell away from the transwell is then calculated. (B) Depth into the hydrogel that GFP+ive AGS cells invade when cultivated with pCAF2 cells transfected with either membrane mCherry (pCAF2 control), ROR2 mCherry or dCD ROR mCherry as indicated on the X axis. include technical and biological repeats. The dashed line at the top of the graph represents the location of the transwell. Boxes represent 90% quartile, the centerline indicates the mean, and the whiskers indicate the range. n = number of AGS cells measured. Results from four experiments representing biological and technical repeats are shown. Significance was calculated using an unpaired t test. (C) Embryos were injected with membrane mCherry mRNA only (control) or plus Ror2 mRNA (Ror2) or Ror23i mRNA (Ror23i) into one cell out of eight blastomeres, and the adjacent cell was injected with Gap43-GFP mRNA to generate two independent clones in the same embryo. (D) The live embryos were mounted and imaged at 6 h postfertilization, and the area of each embryo containing red and green-labeled cells was measured for each condition as a representation of how far cells from each clone (*) had migrated. Scale bar represents 200 µm. (E) Area of embryos containing GFP- or mCherry-positive cells indicated on the X axis for the different conditions (green bars: control—injected with membrane mCherry alone, blue bars: injected with Ror2 mRNA and membrane mCherry, red bars: injected with Ror23i and membrane mCherry). Boxes represent 95% quartile, the centerline indicates the mean, and whiskers indicate the range. Significance was calculated using ordinary one-way ANOVA with Tukey’s multiple comparison test.

Acknowledgments
This image is the copyrighted work of the attributed author or publisher, and ZFIN has permission only to display this image to its users. Additional permissions should be obtained from the applicable author or publisher of the image. Full text @ Proc. Natl. Acad. Sci. USA