IMAGE

Fig. 6.

ID
ZDB-IMAGE-231002-48
Source
Figures for Rogers et al., 2023
Image
Figure Caption

Fig. 6.

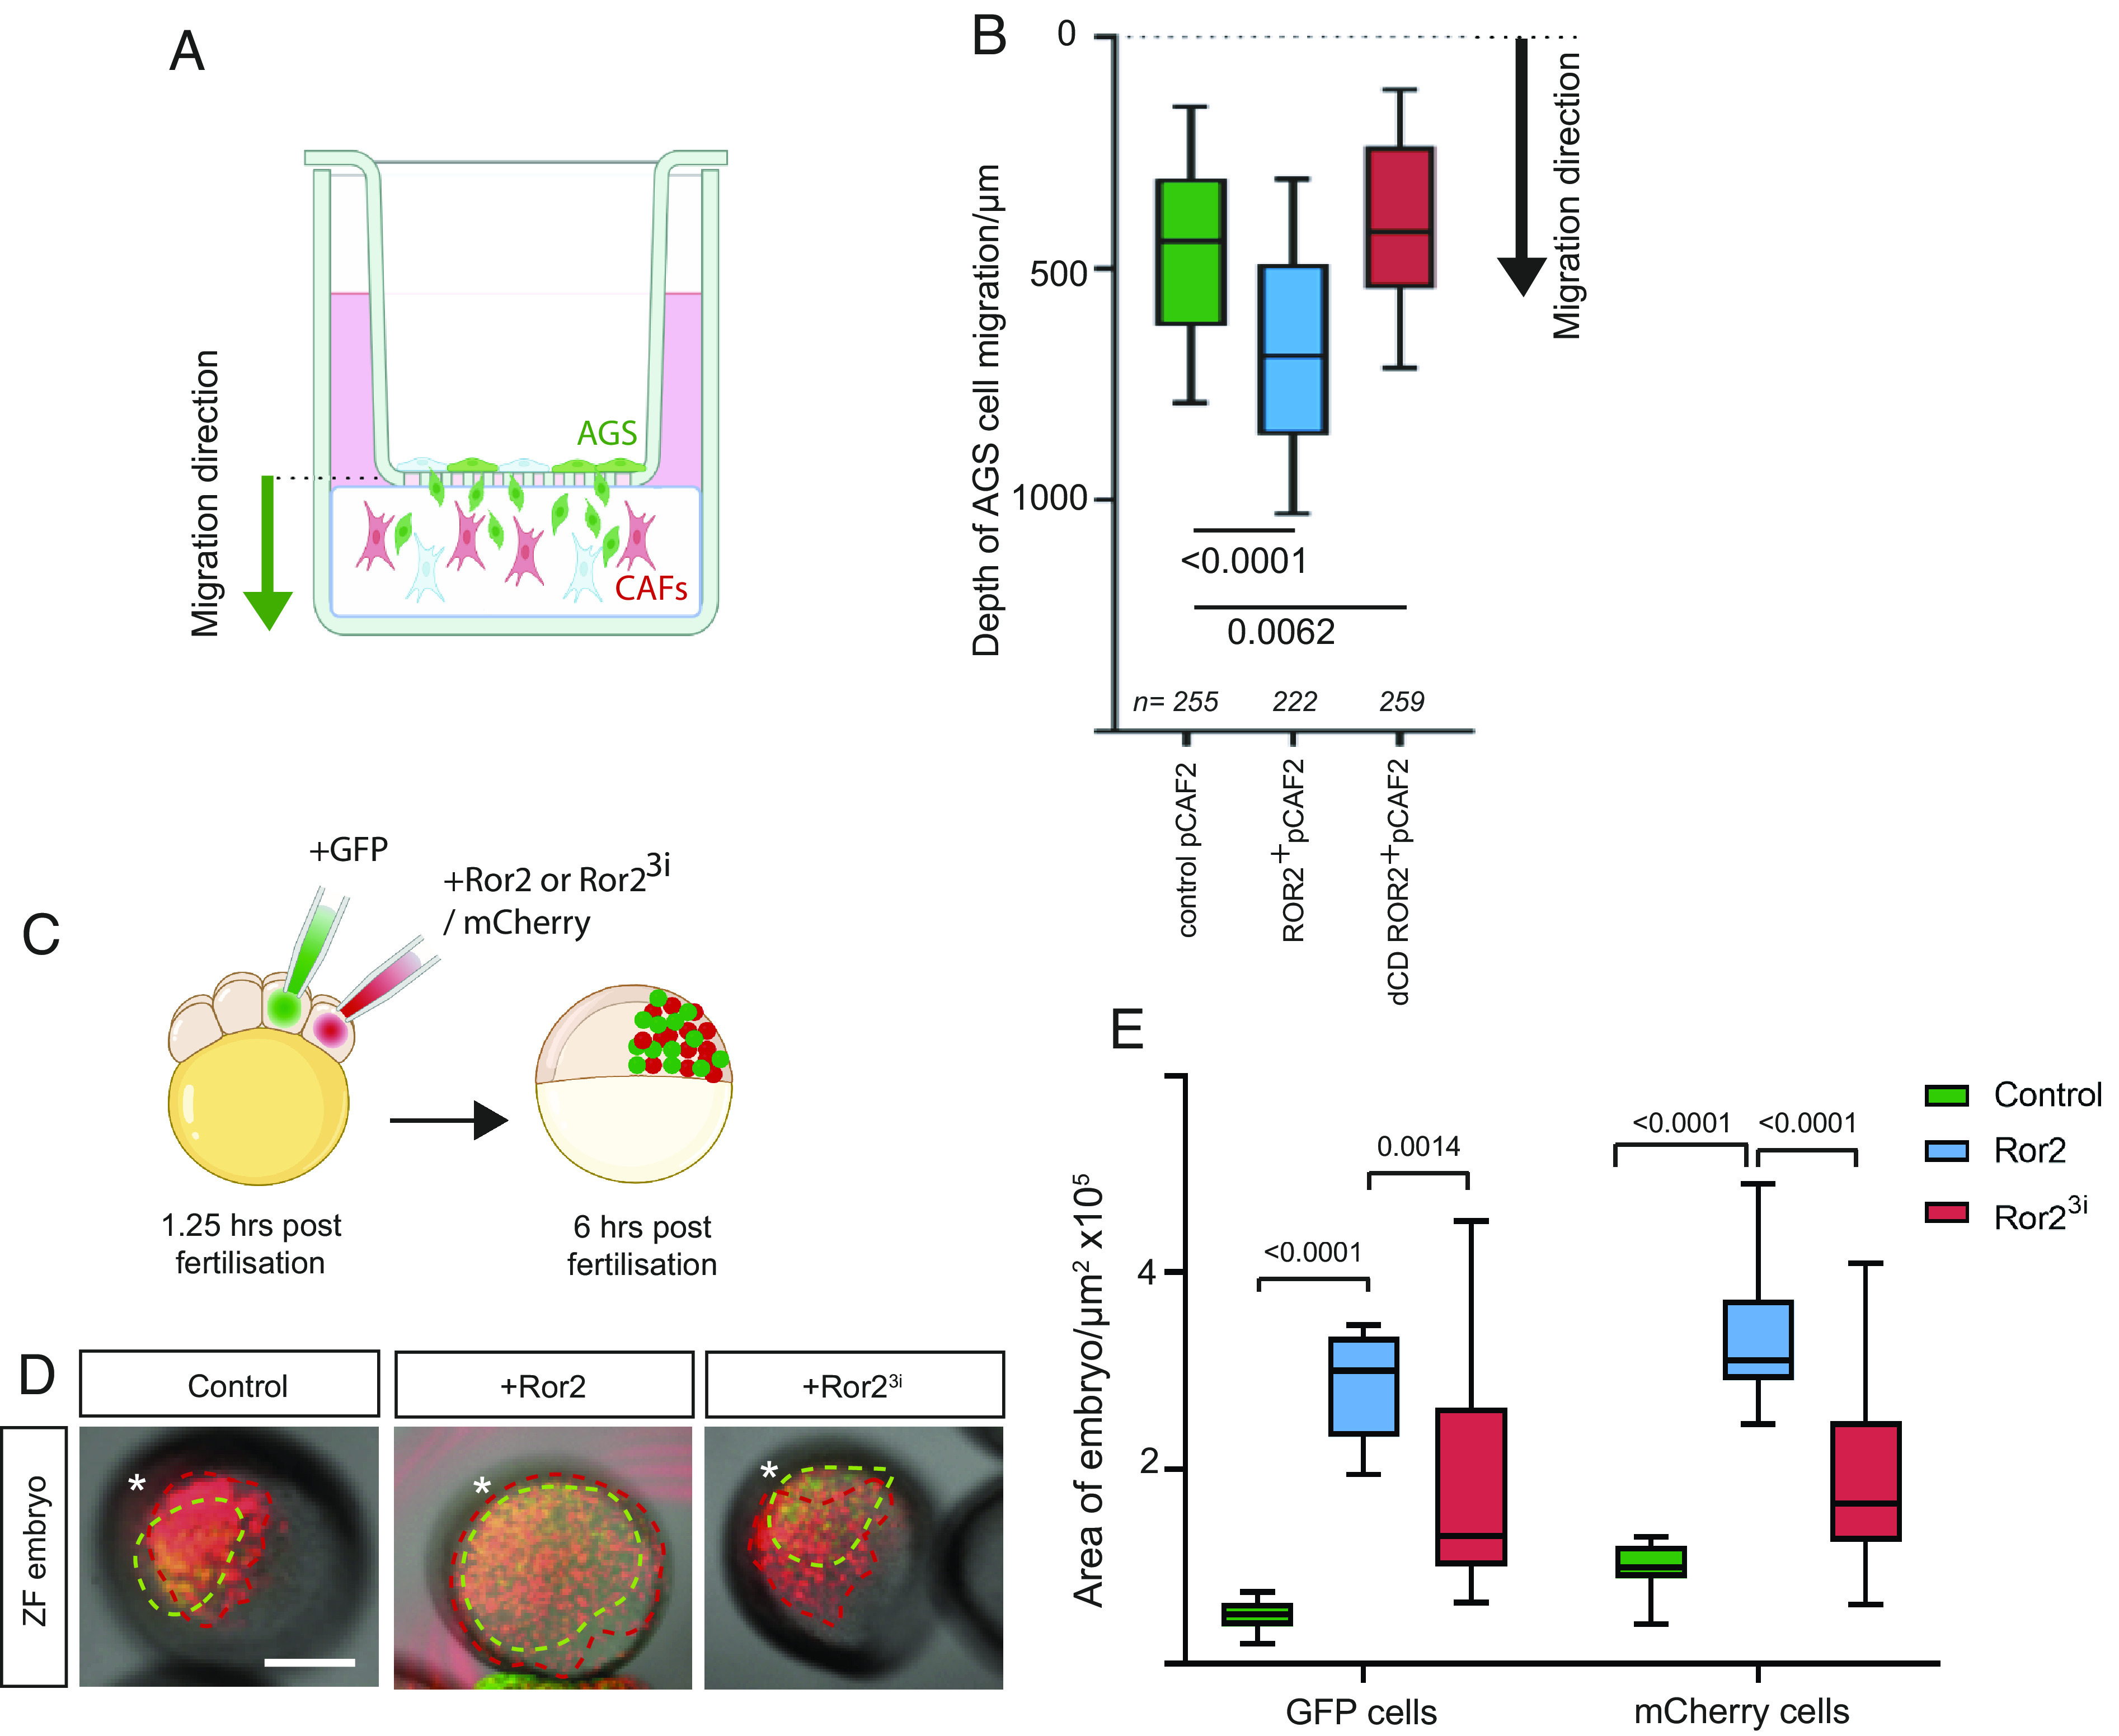
ROR2 induces polarized migration and invasion in 3D models. (A) Schematic demonstrating the 3D invasion assay. AGS cells transiently transfected with membrane GFP are cultured in a monolayer in transwells with an 8-μm pore size. pCAF2 cells transfected with either membrane mCherry, ROR2 mCherry, or dCD ROR2 mCherry are cultured in 3D using GrowDex at the bottom of the well, ensuring contact is made between the GrowDex and the transwell (SI Appendix, Fig. S6D). The black arrow indicates the migratory direction from the GFP-positive AGS cells into the hydrogel containing mCherry labeled CAFs. Following incubation for 72 h, the GrowDex is imaged using fluorescent light microscopy. Invading GFP-positive AGS cells are identified digitally by Imaris based on their size (20 μm in x, y, and z) to exclude cell debris and converted to dots (SI Appendix, Fig. S6E). The distance of each AGS cell away from the transwell is then calculated. (B) Depth into the hydrogel that GFP+ive AGS cells invade when cultivated with pCAF2 cells transfected with either membrane mCherry (pCAF2 control), ROR2 mCherry or dCD ROR mCherry as indicated on the X axis. include technical and biological repeats. The dashed line at the top of the graph represents the location of the transwell. Boxes represent 90% quartile, the centerline indicates the mean, and the whiskers indicate the range. n = number of AGS cells measured. Results from four experiments representing biological and technical repeats are shown. Significance was calculated using an unpaired t test. (C) Embryos were injected with membrane mCherry mRNA only (control) or plus Ror2 mRNA (Ror2) or Ror23i mRNA (Ror23i) into one cell out of eight blastomeres, and the adjacent cell was injected with Gap43-GFP mRNA to generate two independent clones in the same embryo. (D) The live embryos were mounted and imaged at 6 h postfertilization, and the area of each embryo containing red and green-labeled cells was measured for each condition as a representation of how far cells from each clone (*) had migrated. Scale bar represents 200 µm. (E) Area of embryos containing GFP- or mCherry-positive cells indicated on the X axis for the different conditions (green bars: control—injected with membrane mCherry alone, blue bars: injected with Ror2 mRNA and membrane mCherry, red bars: injected with Ror23i and membrane mCherry). Boxes represent 95% quartile, the centerline indicates the mean, and whiskers indicate the range. Significance was calculated using ordinary one-way ANOVA with Tukey’s multiple comparison test.

Acknowledgments
This image is the copyrighted work of the attributed author or publisher, and ZFIN has permission only to display this image to its users. Additional permissions should be obtained from the applicable author or publisher of the image. Full text @ Proc. Natl. Acad. Sci. USA