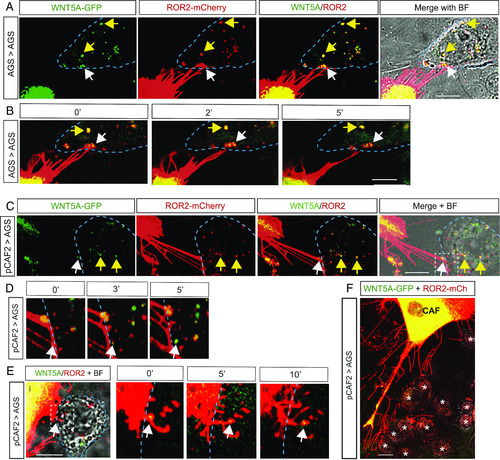
ROR2 and WNT5A complexes are transported from producing pCAF2 cells to receiving AGS cells. (A) AGS cell expresses ROR2-mCherry and WNT5A-GFP on cytoneme tips (white arrowhead), which can be seen contacting a neighboring AGS receiving cell identified in the BF image and indicated by the blue dashed line. Other ROR2/WNT5A complexes from the producing cell can be seen localizing in the receiving cell, as indicated by the yellow arrows. The scale bar represents 10 µm. (B) Time-lapse images, as indicated in minutes, show a ROR2/WNT5A complex (white arrowhead) leaving the cytoneme and colocalizing in the receiving cell shown in A. Other ROR2/WNT5A complexes from the producing cell can be seen continuing to colocalize in the receiving cell over time, as indicated by the yellow arrow. The scale bar represents 10 µm. (C) pCAF2 cell expresses ROR2-mCherry and WNT5A-GFP on cytoneme tips (white arrowhead), which can be seen contacting a neighboring AGS receiving cell identified in the BF image and indicated by the blue dashed line. Other ROR2/WNT5A complexes from the producing cell can be seen localizing in the receiving cell, as indicated by the yellow arrows. The scale bar represents 10 µm. (D) Time-lapse images, as indicated in minutes, of the area denoted by the white dashed box in C. A ROR2/WNT5A complex (white arrowhead) leaves the cytoneme and colocalizes in the receiving cell shown in C. (E) A further example of the transport of ROR2/WNT5A complexes from pCAF2-producing cells to AGS-receiving cells. Images as described for C and D. (E, ii–iv) show the time-lapse images of the white boxed area in E, i. The scale bar represents 10 µm. (F) pCAF2 cell (C) transfected with ROR2 mCherry and WNT5A GFP transport complexes to receiving AGS cells (A) over a large distance. The scale bar represents 10 µm.
|
