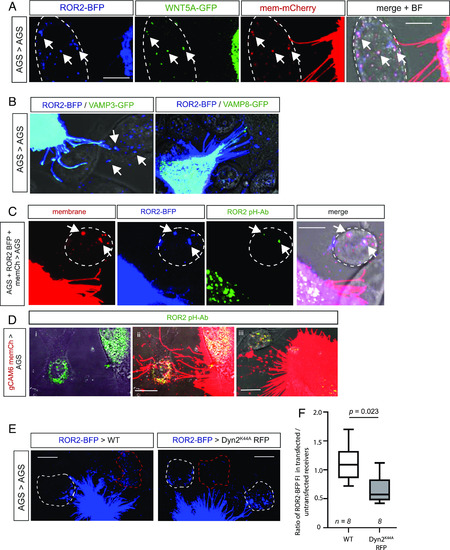
WNT5A/ROR2 complexes are endocytosed by receiving cells and exist in a conformation that enables signaling. (A) Confocal image of an AGS cell transiently transfected with ROR2-BFP, WNT5A-GFP, and membrane mCherry. ROR2/WNT5A/membrane marker complexes in a receiving, untransfected AGS cell, as determined by the bright-field (BF) image, are indicated by white arrowheads. The scale bar represents 10 µm. An orthogonal view is shown in SI Appendix, Fig. S3A. (B) AGS cells were transiently transfected with ROR2-BFP and either VAMP3-GFP or VAMP8-GFP and live imaged using confocal microscopy. The scale bar represents 10 µm (C) AGS cells transfected with membrane mCherry and ROR2-BFP were cocultured with untransfected AGS cells, incubated in anti-ROR2 antibody labeled with a pH-dependent GFP dye for 20 h, and live imaged by confocal microscopy. The scale bar represents 10 µm. (D) gCAM6 cells transfected with membrane mCherry were cocultured with AGS cells, incubated in anti-Ror2 antibody labeled with a pH-dependent GFP dye for 20 h, and live imaged by confocal microscopy. i) and ii) shows the same frame, iii) shows a second example. The scale bar represents 10 µm. (E) AGS cells were transiently transfected with ROR2-BFP and cocultured with AGS cells expressing either membrane mCherry or RFP Dyn2K44A for 24 h. Cells were live imaged using confocal microscopy. The amount of ROR2-BFP in transfected AGS (red dashed line) was quantified. Full images are shown in SI Appendix, Fig. S3D. The scale bar represents 10 µm. (F) The ratio of the amount of ROR2 in the transfected receiving cell compared to the untransfected receiving cell was calculated for control (membrane mCherry) and Dyn2K44A cells. Significance was determined using an unpaired Student t test.
|
