FIGURE SUMMARY
Title

Activator-blocker model of transcriptional regulation by pioneer-like factors

Authors
Riesle, A.J., Gao, M., Rosenblatt, M., Hermes, J., Hass, H., Gebhard, A., Veil, M., GrĂ¼ning, B., Timmer, J., Onichtchouk, D.
Source
Full text @ Nat. Commun.

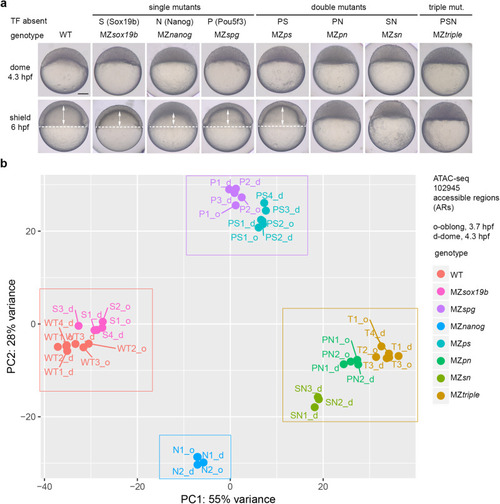
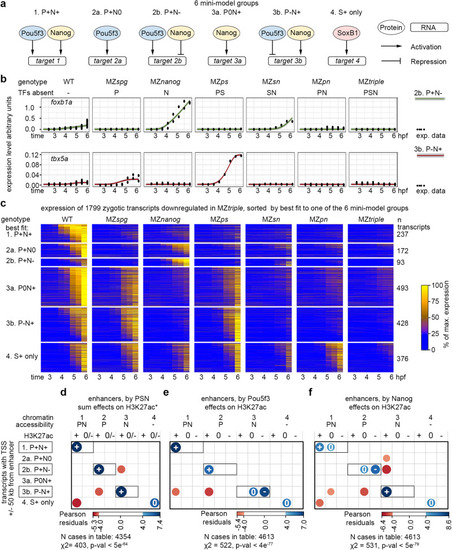
Single and combined mutants by zebrafish zygotic genome activators used in this study.

a Mutant phenotypes at blastula (dome) and midgastrula (shield) stages. White dotted line shows epiboly border; double arrows show the internalized yolk. Scale bar=100 µm. b Principal Component Analysis of ATAC-seq data in all mutants, on the genomic regions accessible in the wild-type (ARs). The data in eight genotypes clustered into four groups (boxed). Source data are provided as a Source Data file 1.

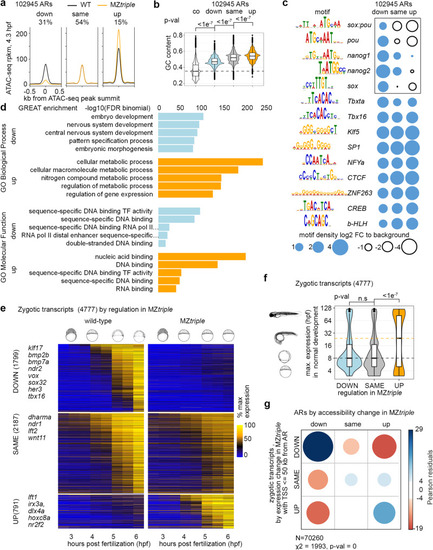
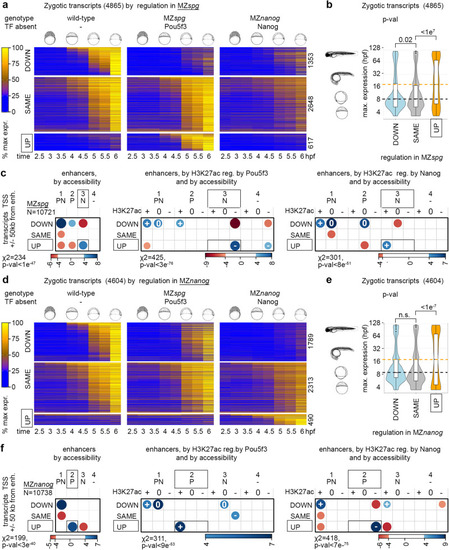
Changes in chromatin accessibility parallel the changes in gene expression in Pou5f3, Sox19b and Nanog triple mutant.

a Three groups of accessible regions (ARs) were selected as follows: in “down” and “up” regions, ATAC-signal was reduced or increased, respectively, in six MZtriple biological replicates compared to seven wild-type biological replicates with FDR < 5%. “same” regions – all the remaining ARs which were considered unchanged. b ARs of “up” group had the highest GC content. P-values for two-sided Tukey-Kramer test; p-value for 1-way ANOVA was <2e−16. n = 102945 accessible regions derived from 6 independent ATAC-seq experiments. n “down”=31910, n”same” = 55439, n”up” = 15596, n “co” = 102944. To obtain control genomic regions (co, dotted line), genomic coordinates of all ARs were shifted 1 kb downstream c Pou5f3, Sox and Nanog-binding motifs (black rectangle) are enriched in “down” ARs. d GREAT analysis. e Three groups of zygotic transcripts by expression change in MZtriple. The heatmap shows normalized expression at eight time points, from pre-ZGA (2.5 hpf) till 6 hpf; example developmental genes at the left. f Group of zygotic genes is prematurely expressed in MZtriple. Y-axis: time of maximal expression in the normal development (3 hpf − 120 hpf from Ref. 10), schematic embryo drawings illustrate the stages. Median expression time of transcripts upregulated in MZtriple was 24 hpf (yellow dotted line), versus 8 hpf for down- or unchanged transcripts (gray dotted line). p-values in two-sided Tukey-Kramer test. “n.s” – non-significant p = 0.1202769 for the groups “DOWN” and “SAME”. p-value in 1-way ANOVA was <2e−16. n “DOWN” = 1799, n”SAME” = 2187, n”up” = 791, the groups were derived from 3 wild-type and 3 MZtriple independent RNA-seq time curve experiments. g Down- or upregulation of chromatin accessibility in MZtriple correlates with respective transcriptional changes of linked genes. Two-sided χ2 test; positive correlations are shown in blue and negative in red. b, f The centers of the box plots correspond to the median values, the lower and upper bounds of the box correspond to the 25th and 75th percentiles, the upper whisker extends from the upper bound to the largest value no further than 1.5 * IQR (inter-quartile range), the lower whisker extends from the lower bound to the smallest value at most 1.5 * IQR. Outlying points beyond the end of the whiskers are plotted individually. Source data are provided as a Source Data file 1 (ad), Source Data file 2 (e, f) and Source Data file 3 (g). Zebrafish embryo drawings were used with permission of John Wiley & Sons - Books, from “Stages of Embryonic Development of the Zebrafish”, Kimmel et al., Developmental Dynamics 203:253-310 (1995); permission conveyed through Copyright Clearance Center, Inc.

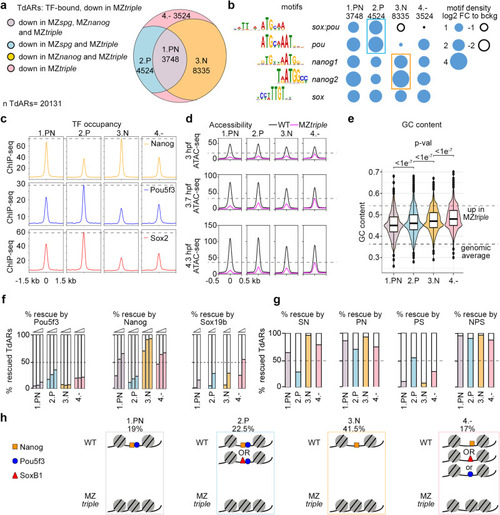
Four types of TdARs by pioneer-like activity of Pou5f3, SoxB1, and Nanog.

a Four groups of TdARs by non-redundant requirements for Pou5f3 and/or Nanog for chromatin accessibility. b Frequencies of PSN motifs in the 4 groups. Note that 2.P and 3.N groups are the most enriched in the Pou5f3- and Nanog- specific motifs, respectively (colored boxes). c 2.P and 3.N groups are the mostly occupied by Pou5f3/SoxB1 and Nanog, respectively (gray dashed lines). Summary ChIP-seq profiles for indicated TFs (rpkm). d PSN establish accessible chromatin starting from major ZGA (3 hpf). ATAC-seq summary profiles in WT and MZtriple at 3, 3.7, and 4.3 hpf (rpkm). Note that chromatin in group 4.- regions in MZtriple is more accessible than in the other groups (gray dashed line). e GC content in four groups is significantly different: note that Pou5f3 is required in two groups with the lowest GC. p-values for two-sided Tukey-Kramer test; p-value for 1-way ANOVA was <2e−16. Groups were derived from at two to four independent ATAC-seq experiments in each of the four genotypes. n “1.PN” = 3748, n ”2.P” = 4524, n ”3.N” = 8335, n “4.-” = 3524. The lower dashed line shows the median genomic control GC content, upper line – median GC content of ARs upregulated in MZtriple. The centers of the box plots correspond to the median values, the lower and upper bounds of the box correspond to the 25th and 75th percentiles, the upper whisker extends from the upper bound to the largest value no further than 1.5 * IQR (inter-quartile range), the lower whisker extends from the lower bound to the smallest value at most 1.5 * IQR. Outlying points beyond the end of the whiskers are plotted individually. f Percentages of TdARs, for four groups, on which chromatin accessibility could be rescued by microinjection of different concentrations of single TFs into 1-cell stage MZnps embryos5. RNA concentrations: low, normal, high for Pou5f3 and Nanog normal and high for Sox19b5. g Percentages of TdARs, for four groups, which could be rescued by microinjection of double or triple combinations of P,S and N TFs into 1-cell stage MZnps embryos5. TFs in normal concentration. h Schematic drawing of four types of regulation of chromatin accessibility, percentage of each group from all TdARs is shown. “OR” – logical operator. Nanog and Sox19b are redundantly required for more regions within group 4.-, than Pou5f3. Source data are provided as a Source Data file 1 (ag).

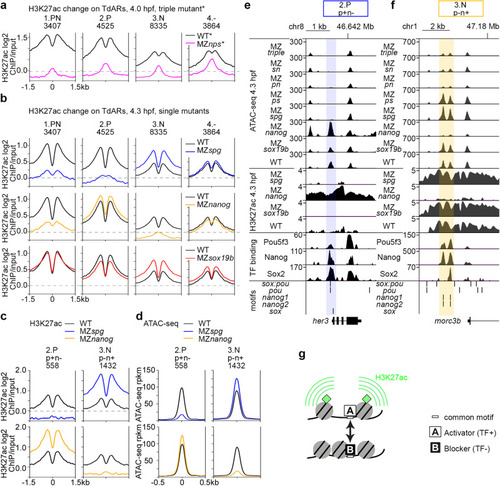
Activator-blocker model: Pou5f3 and Nanog oppose each other effects on H3K27 acetylation and chromatin accessibility on a fraction of enhancers.

a Summary profiles of H3K27ac mark in the WT and MZnps *-data from5. b Summary profiles of H3K27ac histone mark in the wild-type and single mutants, in four types of TdARs: 1.PN, 2.P, 3.N, 4.-. Note the opposite effects of Pou5f3 and Nanog on H3K27 acetylation on the 2.P and the 3.N groups. c Pou5f3 and Nanog have the opposite effects on H3K27ac on 2.P p + n- and 3.N p-n+ antagonistic enhancers. d Pou5f3 and Nanog have the opposite effects on chromatin accessibility on 2.P p + n- and 3.N p-n+ antagonistic enhancers. e,f Genomic browser views show (from bottom to top) motif occurrence, TF binding, H3K27ac and ATAC-seq in the indicated genotypes. e All three TFs bind to sox:pou motif on her3 2.P p + n- antagonistic enhancer (blue shading). f Pou5f3 and Nanog, or all three factors bind nanog motifs on morc3b 3.N p-n+ antagonistic enhancers (yellow shading). g Schematic illustration of activator-blocker model (explanations in the text). Source data are provided as a Source Data file 1 (af).

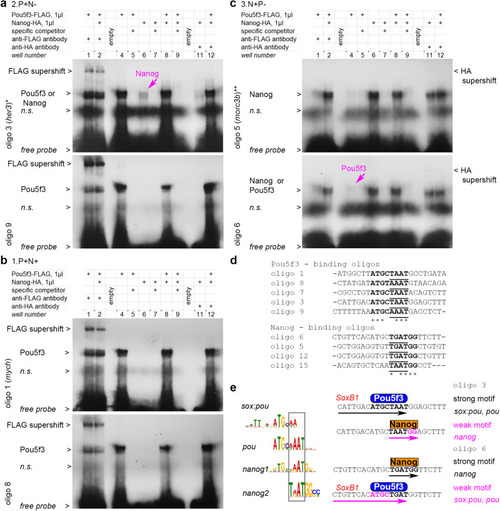
Pou5f3 and Nanog bind in a mutually exclusive manner to overlapping motifs.

ac Gel-retardation assays with the indicated oligos.*, ** - genomic locations oligo 3 and oligo 5 are shown in Fig. 4e, f. a Pou5f3-binding oligos from 2.P + N− antagonistic enhancers. Weaker Nanog binding is also detectable for oligo 3 (magenta arrow); see Fig. S6b with longer exposure time for Nanog-HA supershift with oligo 3 and Nanog binding to oligo 9. b Pou5f3-binding oligos from 1.P + N+ synergistic enhancers (oligo 1 is from mych55 enhancer, Nanog binding was not detectable). See Fig. S6c with longer exposure time for Nanog binding to oligo 8 and oligo 7. c Nanog- binding oligos from 3.N + P- antagonistic enhancers. Weaker Pou5f3 binding is also detectable for oligo 6 (magenta arrow). See Fig. S6d with longer exposure times for Nanog-HA supershifts. d Aligned Pou- and Nanog- strong consensus binding sequences from our assays (in bold); homeodomain-binding part is underlined. e Left: Pou5f3 and Nanog binding motifs share common part, recognized by homeodomains (black box). Right: in oligo 3 and oligo 6, pou and nanog motifs overlap in homeodomain-recognition part, so that only Pou5f3 or only Nanog can contact DNA at the same time. SoxB1 binding part of sox:pou motif20 is indicated in red. n.s – non-specific band. Source data are provided as a Source Data file 4.

Zygotic gene expression is balanced by synergy and competition of Pou5f3 and Nanog on common enhancers.

a Schemes of six alternative mini-model groups for direct target regulation by Pou5f3, Nanog and SoxB1. bfoxb1a and tbx5a transcripts dynamics fitted best to the antagonistic groups 2b. P + N- and 3b. P-N+ respectively. c Heatmap of zygotic genes, downregulated in MZtriple, sorted by best fit to one of the six model groups. df Two-sided χ2 tests, positive correlations between the transcriptomics and genomics groups are shown in blue and negative in red. Exact p-values: p = 4.292e-64 (d), p = 3.128e-77 (e), p = 4.314e-79 (f). Vertical axis: transcriptomics groups. Direct enhancers linked to the promoters of zygotic genes were sorted by best fit transcriptional model. Synergistic and antagonistic model groups are boxed. Horizontal axis: direct enhancers were sorted by chromatin accessibility, and by H3K27ac regulation by sum of PSN activities (d), by Pou5f3 (e), or by Nanog (f). *- data from5. Source data are provided as a Source Data file 2 (a-c) and Source Data file 3 (df).

Pou5f3 blocks premature transcriptional activation by Nanog and vice versa.

ac Pou5f3 blocks transcription from Nanog-dependent enhancers. df Nanog blocks transcription from Pou5f3-dependent enhancers. Zygotic transcripts were sorted by expression change in MZspg (a) or MZnanog (d) compared to the wild-type. Heatmaps show normalized expression at eight time points, from pre-ZGA (2.5 hpf) till 6 hpf; numbers of transcripts in each group are shown at the right. b, e Premature expression of zygotic genes in MZspg (b) or in MZnanog (e). Median expression time in the normal development (3 hpf − 120 hpf from ref. 10) was compared in “UP” “DOWN” and “SAME” groups. p-values in Tukey-Kramer test; p-value in 1-way ANOVA was <2e−16. “n.s” – non-significant p = 0.087583 for the groups “DOWN” and “SAME” in (e). The centers of the box plots correspond to the median values, the lower and upper bounds of the box correspond to the 25th and 75th percentiles, the upper whisker extends from the upper bound to the largest value no further than 1.5 * IQR (inter-quartile range), the lower whisker extends from the lower bound to the smallest value at most 1.5 * IQR. Outlying points beyond the end of the whiskers are plotted individually. b n “DOWN” = 1353, n”SAME” = 2648, n”UP” = 617, the groups were derived from 5 wild-type and 3 MZspg independent RNA-seq time curve experiments. e n “DOWN” = 1789, n”SAME” = 2313, n”up” = 490, the groups were derived from 5 wild-type and 3 MZnanog independent RNA-seq time curve experiments. c, f Two-sided χ2 tests, positive correlations between the transcriptomics and genomics groups are shown in blue and negative in red, scales show Pearson residuals. Exact p-values from left to right: p = 9.391e-48, p = 2.873e-76, p = 7.739e-51 (c), p = 2.574e-40, p = 8.064e-53, p = 6.162e-75 (f). Vertical axis: transcriptomics groups. Direct enhancers were linked to the promoters of zygotic genes within +/−50 kb and sorted according to DOWN”, “SAME” and “UP” transcriptional groups. Horizontal axis: genomic groups. Direct enhancers were sorted by changes in chromatin accessibility, and by H3K27ac regulation by Pou5f3 or Nanog, as indicated. Source data are provided as Source Data file 2 (a, b, d, e) and Source Data file 3 (c, f). Zebrafish embryo drawings were used with permission of John Wiley & Sons - Books, from “Stages of Embryonic Development of the Zebrafish”, Kimmel et al., Developmental Dynamics 203:253-310 (1995); permission conveyed through Copyright Clearance Center, Inc.

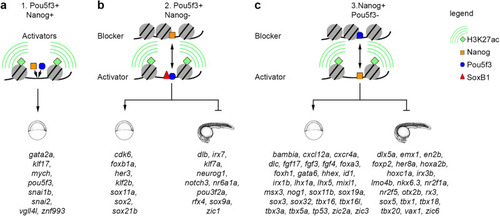
Synergistic and antagonistic Pou5f3/Nanog direct enhancers: the mechanism of action and direct target genes.

a Synergistic enhancers Pou5f3+Nanog + : Pou5f3 and Nanog act as activators. b Antagonistic enhancers Pou5f3+Nanog-: Pou5f3 acts as an activator, Nanog as a blocker. c Antagonistic enhancers Pou5f3-Nanog + : Nanog acts as an activator, Pou5f3 as a blocker. Representative early targets (expressed in the wild-type during 2.5-6 hpf time course), and late targets (prematurely expressed in the mutants by blocker TF during 2.5-6 hpf time course) are indicated by schematic early and late embryo drawings. Source data are provided as a Source Data file 3. Zebrafish embryo drawings were used with permission of John Wiley & Sons - Books, from “Stages of Embryonic Development of the Zebrafish”, Kimmel et al., Developmental Dynamics 203:253-310 (1995); permission conveyed through Copyright Clearance Center, Inc.

Acknowledgments
This image is the copyrighted work of the attributed author or publisher, and ZFIN has permission only to display this image to its users. Additional permissions should be obtained from the applicable author or publisher of the image. Full text @ Nat. Commun.