IMAGE

Fig. 1

ID
ZDB-IMAGE-231002-200
Source
Figures for Riesle et al., 2023
Image
Figure Caption

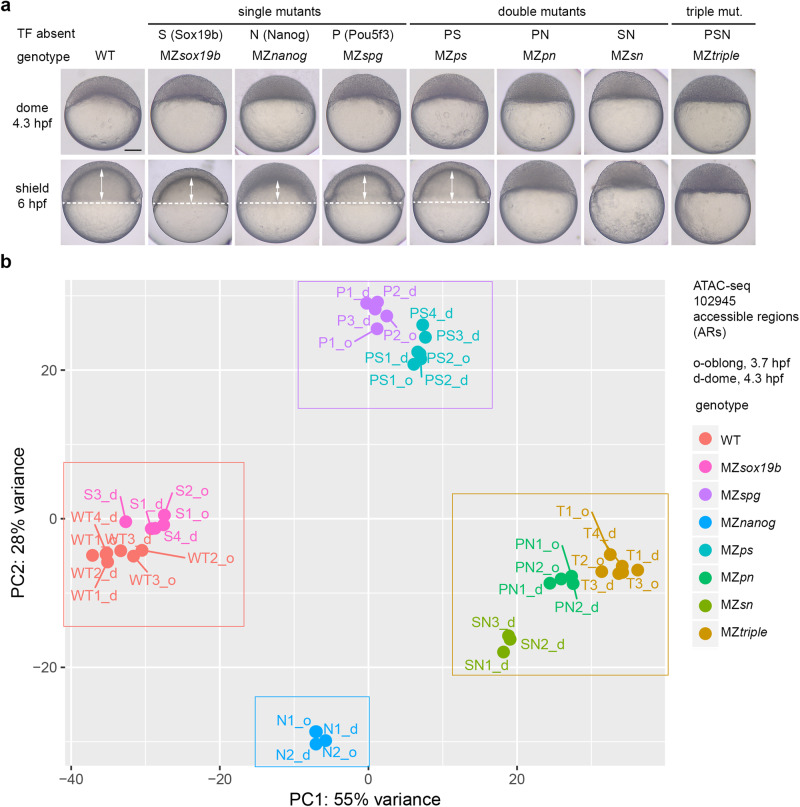
Fig. 1 Single and combined mutants by zebrafish zygotic genome activators used in this study.

a Mutant phenotypes at blastula (dome) and midgastrula (shield) stages. White dotted line shows epiboly border; double arrows show the internalized yolk. Scale bar=100 µm. b Principal Component Analysis of ATAC-seq data in all mutants, on the genomic regions accessible in the wild-type (ARs). The data in eight genotypes clustered into four groups (boxed). Source data are provided as a Source Data file 1.

Acknowledgments
This image is the copyrighted work of the attributed author or publisher, and ZFIN has permission only to display this image to its users. Additional permissions should be obtained from the applicable author or publisher of the image. Full text @ Nat. Commun.