IMAGE

Fig. 2

ID
ZDB-IMAGE-231002-12
Source
Figures for Riesle et al., 2023
Image
Figure Caption

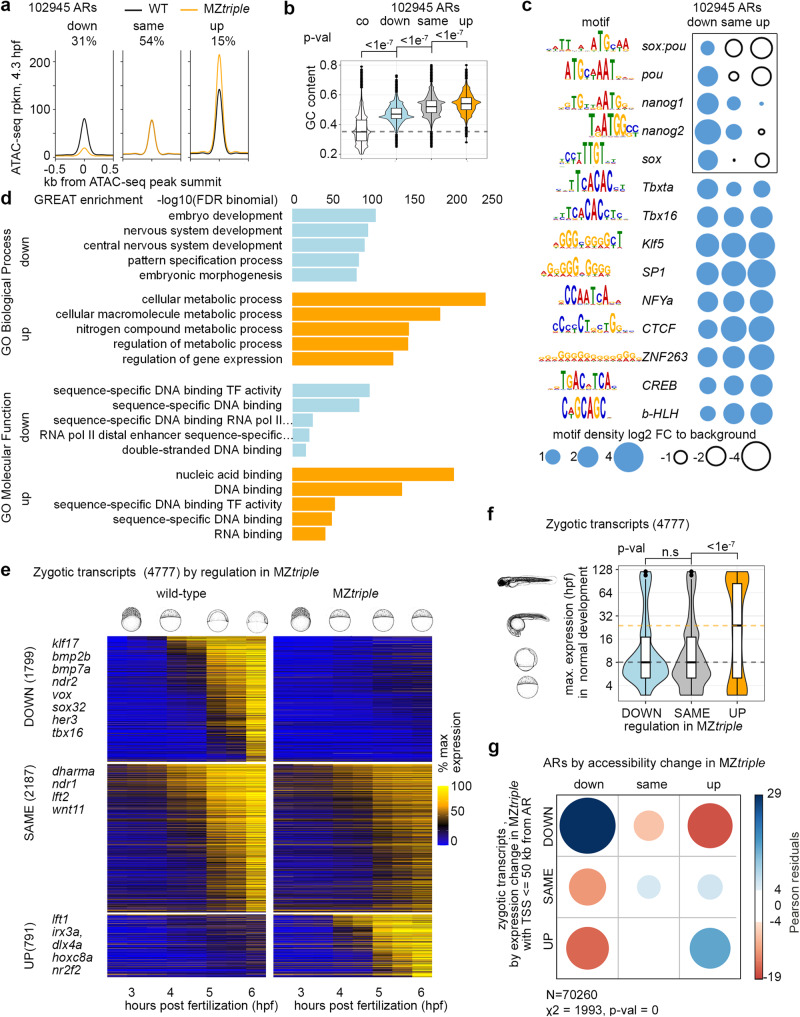
Fig. 2 Changes in chromatin accessibility parallel the changes in gene expression in Pou5f3, Sox19b and Nanog triple mutant.

a Three groups of accessible regions (ARs) were selected as follows: in “down” and “up” regions, ATAC-signal was reduced or increased, respectively, in six MZtriple biological replicates compared to seven wild-type biological replicates with FDR < 5%. “same” regions – all the remaining ARs which were considered unchanged. b ARs of “up” group had the highest GC content. P-values for two-sided Tukey-Kramer test; p-value for 1-way ANOVA was <2e−16. n = 102945 accessible regions derived from 6 independent ATAC-seq experiments. n “down”=31910, n”same” = 55439, n”up” = 15596, n “co” = 102944. To obtain control genomic regions (co, dotted line), genomic coordinates of all ARs were shifted 1 kb downstream c Pou5f3, Sox and Nanog-binding motifs (black rectangle) are enriched in “down” ARs. d GREAT analysis. e Three groups of zygotic transcripts by expression change in MZtriple. The heatmap shows normalized expression at eight time points, from pre-ZGA (2.5 hpf) till 6 hpf; example developmental genes at the left. f Group of zygotic genes is prematurely expressed in MZtriple. Y-axis: time of maximal expression in the normal development (3 hpf − 120 hpf from Ref. 10), schematic embryo drawings illustrate the stages. Median expression time of transcripts upregulated in MZtriple was 24 hpf (yellow dotted line), versus 8 hpf for down- or unchanged transcripts (gray dotted line). p-values in two-sided Tukey-Kramer test. “n.s” – non-significant p = 0.1202769 for the groups “DOWN” and “SAME”. p-value in 1-way ANOVA was <2e−16. n “DOWN” = 1799, n”SAME” = 2187, n”up” = 791, the groups were derived from 3 wild-type and 3 MZtriple independent RNA-seq time curve experiments. g Down- or upregulation of chromatin accessibility in MZtriple correlates with respective transcriptional changes of linked genes. Two-sided χ2 test; positive correlations are shown in blue and negative in red. b, f The centers of the box plots correspond to the median values, the lower and upper bounds of the box correspond to the 25th and 75th percentiles, the upper whisker extends from the upper bound to the largest value no further than 1.5 * IQR (inter-quartile range), the lower whisker extends from the lower bound to the smallest value at most 1.5 * IQR. Outlying points beyond the end of the whiskers are plotted individually. Source data are provided as a Source Data file 1 (ad), Source Data file 2 (e, f) and Source Data file 3 (g). Zebrafish embryo drawings were used with permission of John Wiley & Sons - Books, from “Stages of Embryonic Development of the Zebrafish”, Kimmel et al., Developmental Dynamics 203:253-310 (1995); permission conveyed through Copyright Clearance Center, Inc.

Acknowledgments
This image is the copyrighted work of the attributed author or publisher, and ZFIN has permission only to display this image to its users. Additional permissions should be obtained from the applicable author or publisher of the image. Full text @ Nat. Commun.