|
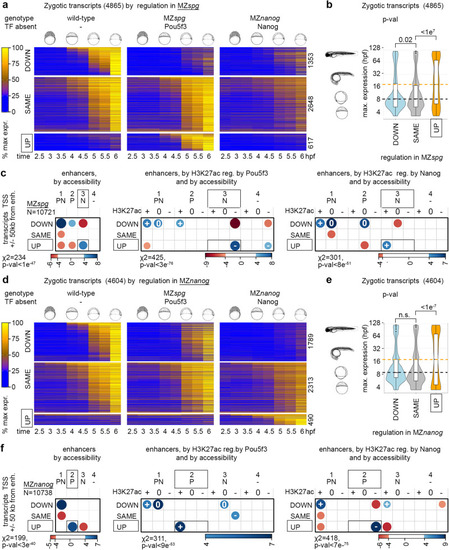
Pou5f3 blocks premature transcriptional activation by Nanog and vice versa. a–c Pou5f3 blocks transcription from Nanog-dependent enhancers. d–f Nanog blocks transcription from Pou5f3-dependent enhancers. Zygotic transcripts were sorted by expression change in MZspg (a) or MZnanog (d) compared to the wild-type. Heatmaps show normalized expression at eight time points, from pre-ZGA (2.5 hpf) till 6 hpf; numbers of transcripts in each group are shown at the right. b, e Premature expression of zygotic genes in MZspg (b) or in MZnanog (e). Median expression time in the normal development (3 hpf − 120 hpf from ref. 10) was compared in “UP” “DOWN” and “SAME” groups. p-values in Tukey-Kramer test; p-value in 1-way ANOVA was <2e−16. “n.s” – non-significant p = 0.087583 for the groups “DOWN” and “SAME” in (e). The centers of the box plots correspond to the median values, the lower and upper bounds of the box correspond to the 25th and 75th percentiles, the upper whisker extends from the upper bound to the largest value no further than 1.5 * IQR (inter-quartile range), the lower whisker extends from the lower bound to the smallest value at most 1.5 * IQR. Outlying points beyond the end of the whiskers are plotted individually. b n “DOWN” = 1353, n”SAME” = 2648, n”UP” = 617, the groups were derived from 5 wild-type and 3 MZspg independent RNA-seq time curve experiments. e n “DOWN” = 1789, n”SAME” = 2313, n”up” = 490, the groups were derived from 5 wild-type and 3 MZnanog independent RNA-seq time curve experiments. c, f Two-sided χ2 tests, positive correlations between the transcriptomics and genomics groups are shown in blue and negative in red, scales show Pearson residuals. Exact p-values from left to right: p = 9.391e-48, p = 2.873e-76, p = 7.739e-51 (c), p = 2.574e-40, p = 8.064e-53, p = 6.162e-75 (f). Vertical axis: transcriptomics groups. Direct enhancers were linked to the promoters of zygotic genes within +/−50 kb and sorted according to DOWN”, “SAME” and “UP” transcriptional groups. Horizontal axis: genomic groups. Direct enhancers were sorted by changes in chromatin accessibility, and by H3K27ac regulation by Pou5f3 or Nanog, as indicated. Source data are provided as Source Data file 2 (a, b, d, e) and Source Data file 3 (c, f). Zebrafish embryo drawings were used with permission of John Wiley & Sons - Books, from “Stages of Embryonic Development of the Zebrafish”, Kimmel et al., Developmental Dynamics 203:253-310 (1995); permission conveyed through Copyright Clearance Center, Inc.
|