FIGURE SUMMARY
Title

The mesencephalic locomotor region recruits V2a reticulospinal neurons to drive forward locomotion in larval zebrafish

Authors
Carbo-Tano, M., Lapoix, M., Jia, X., Thouvenin, O., Pascucci, M., Auclair, F., Quan, F.B., Albadri, S., Aguda, V., Farouj, Y., Hillman, E.M.C., Portugues, R., Del Bene, F., Thiele, T.R., Dubuc, R., Wyart, C.
Source
Full text @ Nat. Neurosci.

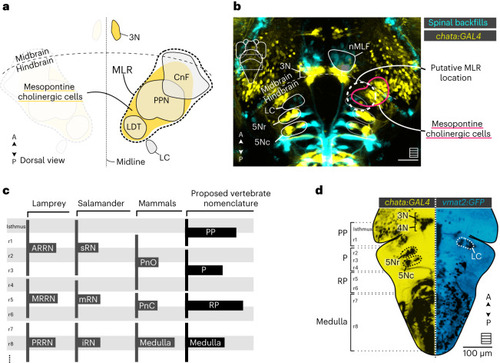
The putative location of the MLR in zebrafish inferred from previous studies in other vertebrates.

a, Schematic illustration of the MLR location in vertebrates (dashed line) in relation to the mesopontine cholinergic cells (yellow). The structures classically defined as part of the MLR are the PPN, CnF and LDT. The characteristics of the structures were taken from the Allen Mouse Brain Atlas (https://atlas.brain-map.org). b, Schematic of the larval zebrafish brain depicting the probable location of the MLR (dashed white line, dorsal view) in relation to the LC and the mesopontine cholinergic cells labeled in the Tg(chata:GAL4) transgenic line. The hindbrain RSNs and the nMLF were labeled using spinal backfills. Scale bar, 50 µm. c, Scheme comparing the nomenclature and boundaries of the brain stem areas in different vertebrate classes. d, Applied nomenclature in the larval zebrafish brain stem. The anatomical landmarks were defined based on the projecting neurons labeled using spinal backfills (not shown) and the expression patterns of the Tg(chata:GAL4) (yellow) and Tg(vmat2:GFP) (cyan) transgenic lines. The PP region contains the isthmus and r1. The trochlear nucleus (4N) lies in the rostral border of the isthmus; among other structures, r1 contains the LC. The P region is defined rostrally by r2, containing the rostral trigeminal motor nucleus (5Nr), the caudal part of the trigeminal motor nucleus (5Nc) and caudally by rhombomere 4 (r4), including the Mauthner cell (M cell). The RP region consists of rhombomere 5 (r5) and rhombomere 6 (r6) containing the abducens (6N) and facial nucleus (7N), respectively. The medulla is delimited rostrally by rhombomere 7 (r7) and caudally by the rostral spinal cord. Under this nomenclature, the oculomotor nucleus (3N) is a midbrain structure, but the nMLF should be considered as a diencephalic structure. All images were taken from the Web interface of mapzebrain (https://fishatlas.neuro.mpg.de/). A, anterior; P, posterior.

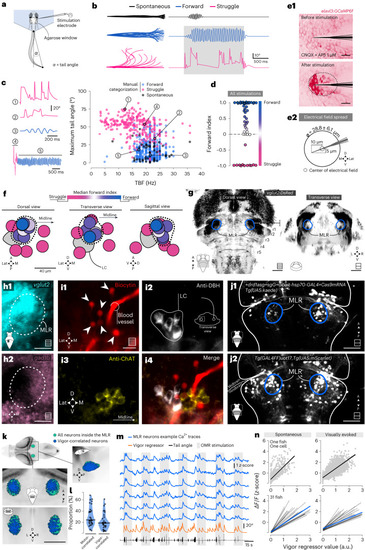
Anatomical and functional description of the MLR in larval zebrafish reveals neurons triggering forward locomotion and encoding vigor.

a, Schematic illustration of the behavioral experiments with MLR stimulations. b, Typical behavioral responses shown as superimposed images of the larval zebrafish tail (left) and corresponding tail angle trace (right) of a spontaneous swim episode (black) and electrically evoked episodes corresponding to a forward swim (blue) or to a struggle (magenta). The gray bar indicates the stimulation duration. c, Left: representative example of tail angle traces. Right: maximum absolute tail angle versus median TBF of all locomotor episodes elicited by electrical stimulation classified as forward swims (blue) or struggles (magenta) (13 fish, 164 stimulations, 786 episodes). Spontaneous episodes are shown as black dots. d, Distribution of forward index for all simulations applied. e1, Calibration experiments where the fluorescence signal was used to evaluate the spread of the electrical field. Scale bars, 10 µm. e2, Scheme of the effective spread of the electrical field (5 fish, 3 electrodes, 10 stimulations). f, Location of all stimulation sites investigated color-coded using the median forward index. The dashed line represents the MLR location covering all stimulation sites with a median forward index above 0. g, Location of the MLR in larval zebrafish in reference to Tg(vglut2:DsRed) larvae of the mapzebrain atlas. Scale bars, 50 µm. Maximum projection Z-stacks are schematized in the bottom right corner with squares including multiple lines; single optical sections are schematized in the bottom right corner with squares including a single line. h, Z-stack projection of the MLR region in Tg(vglut2:DsRed) (h1) and Tg(gad1b:GFP) (h2) transgenic lines. Scale bars, 20 µm. i1i4, Distribution of retrogradely labeled MLR neurons (i1, red) in the vicinity of neurons immunoreactive to DBH (white) (i2) and ChAT (yellow) (i3,i4). This experiment was successfully replicated twice. j1, Midbrain and hindbrain region of 6-dpf Tg(UAS:kaede) larvae coinjected with the sgRNA targeting a cut site upstream of the drd1a locus. j2, Tg(UAS:mScarlet) expression pattern under the control of the Tg(GAL4FF)uot17 driver. Scale bars, 40 µm. k, Location of ROIs inside the MLR from n = 31 fish used for light sheet functional imaging. l, Violin plot showing the proportions of MLR neurons whose activity was correlated with motor activity (left) and MLR neurons whose activity was correlated with vigor of the bout (right) (the line is the median value). m, Example traces from vigor-correlated MLR neurons of larva exposed to OMR stimulation. n, Top: calcium activity of a representative vigor-correlated neuron in one fish plotted against the vigor regressor of the locomotor output for spontaneous (left) and visually evoked (right) swim bouts. Bottom: regression analysis for all 1,235 vigor-correlated MLR neurons for all 31 fish for spontaneous (left) and visually evoked (right) swim bouts. Each black line represents the correlation per fish of all vigor-correlated neurons in the MLR locus. The blue line represents the correlation of all 1,235 vigor-correlated MLR neurons across the 31 fish. A, anterior; P, posterior; D, dorsal; V, ventral; L, left; R, right; M, medial; Lat, lateral.

Source data

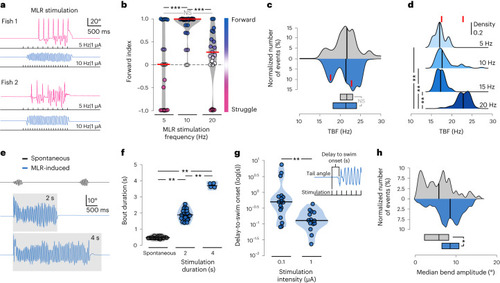
MLR stimulation parameters set the duration, time onset, amplitude and locomotor frequency of forward swimming

a, Representative behavioral responses to MLR stimulation at different frequencies in two different larvae. b, Forward index for all the stimulation sites according to stimulation frequency (10 fish and 64 stimulation trials; 5 Hz: n = 19 stimulations, −0.06 ± 0.8; 10 Hz: n = 26 stimulations, 0.919 ± 0.24; 20 Hz: n = 19 stimulations, 0.27 ± 0.55 s; Kruskal–Wallis test, χ2 = 105.85, d.f. = 3, P < 0.001, two-sided Wilcoxon pairwise comparisons: 5 Hz versus 10 Hz: ***P < 0.001; 5 Hz versus 20 Hz: P = 0.17; 10 Hz versus 20 Hz: ***P < 0.001). P values were adjusted using the Bonferroni method. c, Distribution of median TBF on MLR stimulation (the red line represents the peaks of the distributions: 17.5 Hz and 23.2 Hz) compared to spontaneous locomotion (11 fish; spontaneous: 57 episodes, 21.6 ± 3.1 Hz; MLR stimulation: 242 episodes, 21.3 ± 2.9 Hz; Mann–Whitney U-test, W = 6,721, P = 0.7; the boxes at the bottom show the median and 25–75th quantiles). d, A 20-Hz MLR stimulation elicited swimming with higher TBF compared to lower stimulation frequency or spontaneous swimming (11 fish; 5 Hz: ten episodes, 17.54 ± 1.31 Hz; 10 Hz: 60 episodes, 18.7 ± 2.34 Hz; 15 Hz: 18 episodes, 17.66 ± 1.07 Hz; 20 Hz: 154 episodes, 23.1 ± 1.618 Hz; Kruskal–Wallis test, χ2 = 6237, d.f. = 31, P < 0.001, two-sided Wilcoxon pairwise comparisons: 5 Hz versus 10 Hz: P = 0.3; 5 Hz versus 15 Hz: P = 0.9; 5 Hz versus 20 Hz: P < 0.001; 10 Hz versus 15 Hz: P = 0.2; 10 Hz versus 20 Hz: P < 0.001; 15 Hz versus 20 Hz: P < 0.001). P values were adjusted using the Bonferroni method. The red lines depict the peak values for each of the distributions from c. e, Example tail angle traces for spontaneous forward swims (black, top trace) and forward swims induced by stimulating the MLR for 2 s (blue, middle trace) or 4 s (blue, bottom trace). The gray box indicates the duration of the train. f, Quantification of the duration of forward swims according to the duration of the MLR stimulation (10 Hz, 1 µA), displayed as a violin plot with the black line indicating the median value (8 fish; spontaneous: 27 episodes, 0.41 ± 0.15 s; 2-s stimulation: 19 episodes, 1.91 ± 0.44 s; 4-s stimulation: 4 episodes, 3.65 ± 0.315 s; Kruskal–Wallis test, χ2 = 38.6, d.f. = 2, **P < 0.001, Wilcoxon pairwise comparisons: spontaneous versus 2-s train stimulation, P < 0.001; spontaneous versus 4-s train stimulation, **P < 0.001; 2 s versus 4 s, **P < 0.001). g, Violin plot displaying the distribution of the delay to swim onset (the black line represents the median value) (9 fish; all MLR stimulation set at 10 Hz for 2 s; 0.1 µA: 17 episodes, 1.22 ± 1.97 s; 1 µA: 14 episodes, 0.15 ± 0.11 s; Mann–Whitney U-test, W = 199, *P < 0.001). h, MLR-evoked forward swims reliably exhibited larger TBA than spontaneous forward swims (12 fish; spontaneous: 67 episodes, 5.9 ± 3.16°; MLR stimulation: 172 episodes, 8.5 ± 3.8°; Mann–Whitney U-test, W = 8102, *P < 0.001). In all panels, the black line indicates the median value.

Source data

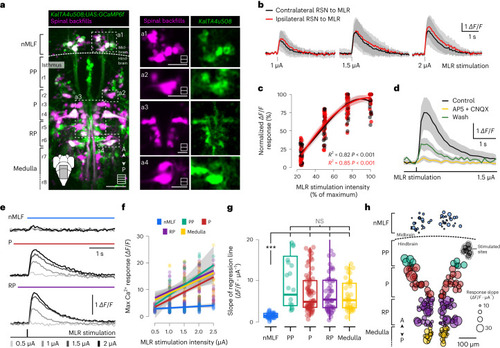
Unilateral MLR stimulation recruits ipsilateral and contralateral hindbrain RSNs but not the nMLF.

a, Z-stack projection of ten optical sections acquired from 6-dpf Tg(KalTA4u508;UAS:GCaMP6f) larvae (green) with RSNs backfilled (magenta). Right: magnified images of the areas denoted in the left. Scales bars, 100 µm (left) and 50 µm (right). b, Average calcium response traces of hindbrain RSNs for one example fish in response to increasing MLR stimulation intensities (mean ± s.d., 18 neurons, grouped according to location of the electrode; red, ipsilateral; black, contralateral). c, Maximum calcium responses of RSNs pooled according to location either ipsilateral (red) or contralateral (black) relative to the stimulation electrode (5 fish, 53 neurons). Data followed a cubic polynomial function (ipsilateral: R2 = 0.85, F(112, 13.02) = 211.3, P < 0.001; contralateral: R2 = 0.82, F(100, 13.45) = 151.1, P < 0.001). d, Bath application of the glutamatergic antagonists CNQX (70 µM) and AP5 (70 µM) blocked the MLR-induced calcium responses of RSNs (2 fish, 72 cells, mean ± s.d.: 40-min drug incubation, 7.6 ± 2.6% of pre-drug application, after 180 min of washout 23 ± 8% of pre-drug application). e, Typical calcium transients of individual neurons in response to increasing intensity of MLR stimulations. f, Relationship between maximum calcium response amplitudes and MLR stimulation intensity for an example larva. Each dot represents a neuron. The linear correlation (line) was calculated for all the neurons in each defined region. g, Quantification of the slope reflecting the linear correlation between change of fluorescence and MLR stimulation intensity for all neurons tested. The box plots are depicted as the mean (center), first and third quartiles (lower and upper box limits), and minima and maxima (bottom and top whiskers) (9 fish, nMLF: 43 neurons, 0.74 ± 1.4 ΔF/F· µA−1; PP: 12 neurons, 7.8 ± 5.9 ΔF/F· µA−1; P: 72 neurons, 5.1 ± 4.7 ΔF/F· µA−1; RP: 52 neurons, 5.2 ± 5.7 ΔF/F· µA−1; medulla: 38 neurons, 4.2 ± 3.8 ΔF/F· µA−1; Kruskal–Wallis test, χ2 = 48.2, P < 0.001, Wilcoxon pairwise comparisons. P values were adjusted using the Bonferroni method: nMLF versus PP: P < 0.001; nMLF versus P: P < 0.001; nMLF versus RP: P < 0.001; nMLF versus medulla: P < 0.001; PP versus P: P = 0.26; PP versus RP: P = 0.26; PP versus medulla: P = 0.58; P versus RP: P = 0.91; P versus medulla: P = 0.58; RP versus medulla: P = 0.73). Three asterisks correspond to P < 0.001. h, Spatial distribution of RSN size coded using the slope plotted in g. MLR stimulation loci are displayed as gray dots.

Source data

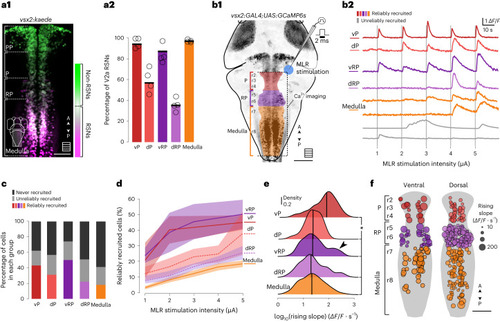
Single-pulse MLR stimulations gradually recruit a subset of V2a RSNs.

a, Distribution and density of RSNs in the V2a neuronal population. a1, Example image of the hindbrain of 5-dpf Tg(vsx2:Kaede) larval zebrafish after photoconverting Kaede protein in the rostral spinal cord. Scale bar, 50 µm. a2, Mean proportion of V2a RSNs (4 fish). b1, Schematic illustration of the experiments investigating V2a neuron recruitment in response to MLR stimulation in paralyzed Tg(vsx2:GAL4;UAS:GCaMP6s) transgenic 6-dpf larval zebrafish. b2, Typical calcium traces of reliably recruited V2a neurons in the different anatomical regions investigated (top, colored traces: vP, dP, vRP, dRP and medulla). The gray traces at the bottom represent neurons not labeled as reliably recruited. c, The recruitment of V2a neurons fell into three groups: reliably recruited (the color corresponds to reliably recruited neurons in a given anatomical area); unreliably recruited (gray); and not recruited (black) (5 fish, total 1,781 neurons; vP: 42 neurons; dP: 96 neurons; vRP: 88 neurons; dRP: 475 neurons; medulla: 1,080 neurons). d, Proportions of reliably recruited V2a neurons (mean ± s.d.) responding at each MLR stimulation intensity (proportions are relative to the numbers of V2a neurons in each anatomical group defined in b). e, Distribution of calcium transient rising slopes in reliably recruited neurons. The line is the median value (median ± s.d., 5 fish; vP: 18 neurons, 76 events, 64.4 ± 67.6 ΔF/F· s−1; dP: 29 neurons, 87 events, 23.4 ± 20.2 ΔF/F · s−1; vRP: 44 neurons, 177 events, 30.6 ± 43.3 ΔF/F · s−1; dRP: 100 neurons, 326 events, 27.1 ± 30.7 ΔF/F · s−1; medulla: 183 neurons, 583 events, 24 ± 27.3 ΔF/F · s−1; two-sided Kruskal–Wallis test, χ2 = 141.68, P < 0.001. Wilcoxon pairwise comparisons: vP versus dP: P < 0.05; vP versus vRP: P < 0.01; vP versus dRP: P < 0.01; vP versus medulla: P < 0.001; dP versus vRP: P = 1.0; dP versus dRP: P = 1.0; dP versus medulla: P = 1.0; vRP versus dRP: P = 1.0; vRP versus medulla: P = 1.0; dRP versus medulla: P = 1.0). P values were adjusted using the Bonferroni method. f, Location of reliably recruited V2a neurons (dot size scaled with the median of all computed rising slopes for each neuron).

Source data

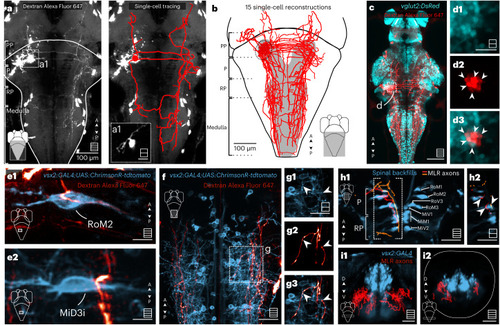
MLR neurons project bilaterally to V2a RSNs forming putative axosomatic synapses in the P and RP areas and axodendritic synapses in the medulla.

a,a1, Left: forsal view of a Z-stack showing the projection pattern of an MLR neuron that was electroporated with Dextran Alexa Fluor 647. Right: reconstruction of the arborization pattern. b, Reconstruction of electroporated neurons with somata located in the MLR locus (7 fish, 15 neurons). c, The MLR contains many glutamatergic neurons projecting to the reticular formation. Scale bar, 100 µm. d1d3, The single plane revealed that many MLR electroporated neurons (red) were glutamatergic, as shown by the overlap with the Tg(vglut2:DsRed) transgenic line (cyan) (7 fish, 14 neurons). Scale bar, 20 µm. e, Electroporation of MLR neurons (red) in Tg(vsx2:GAL4;UAS:ChrimsonR-tdtomato) (blue) transgenic fish. Putative connections of the MLR to an ipsilateral P RSN (e1) and a contralateral RP RSN (e2). Scale bars, 10 µm. f,g, Z-stack of the medulla region (f) showing the typical projection pattern on the MLR neurons to the lateral dendritic area (g1g3). h1, Dorsal view of a Z-stack of spinal backfills labeling (blue) and two examples of MLR neurons (orange and red) taken from the single-cell atlas mapzebrain. h2, Single plane of the region denoted in h1 showing the axons of the MLR neurons reaching the soma of the P and RP RSNs. i, Coronal view of a Z-stack of V2a neurons (blue) and all MLR neurons recovered from the single-cell atlas mapzebrain (red) in the RP region (i1) and caudal medulla (i2). Scale bars, 40 µm. In all panels, maximum projection Z-stacks are schematized in the bottom right corner, with squares including multiple lines and single optical sections schematized with squares including a single line.

Source data

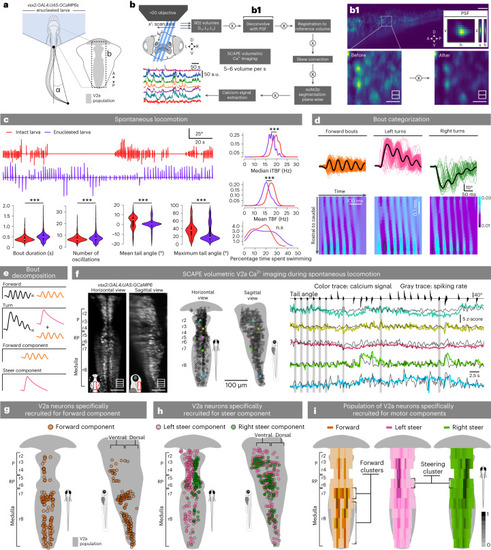
Whole-population brain stem V2a neurons recruitment during spontaneous swimming using high-speed, single-objective light sheet microscopy.

a, Schematic illustration of the experiment investigating hindbrain V2a neurons recruitment during spontaneous locomotion in enucleated 6-dpf Tg(vsx2:GAL4;UAS:GCaMP6s) larvae. b, Pipeline workflow developed for the SCAPE microscopy adapted from refs. 45 and 46. b1, Example of deconvolved image using the system’s experimental PSF (Methods). c, Top left: typical tail angle trace exhibited by intact (red, top) and enucleated (violet, bottom) larvae during recordings (intact: 5 larvae, 512 swim bouts; enucleated: 12 larvae, 3,946 swim bouts). Bottom left: violin plots depicting the distribution of bout duration (intact: 432 ± 340 ms; enucleated: 532 ± 340 ms; enucleated > intact with P < 0.001, Wilcoxon rank-sum test), number of oscillations (intact: 7.51 ± 6.3; enucleated: 8.3 ± 6.3; enucleated > intact with P < 0.001, Wilcoxon rank-sum test), mean tail angle (intact: 2.14 ± 6.6°; enucleated: 0.45 ± 6.6°; enucleated = intact with P < 0.001, Wilcoxon rank-sum test) and maximum absolute tail angle (intact: 36.43 ± 23.48°; enucleated: 27.15 ± 23.48°; enucleated < intact with P < 0.001, two-sided Wilcoxon rank-sum test) of each episode, in each condition. The box plots depict the mean (center), first and third quartiles (lower and upper box limits), and minima and maxima (bottom and top whiskers). Right: density distribution of TBF across the two conditions computed as either the median iTBF or mean TBF. Mean iTBF was greater in intact larvae (intact: 17.12 ± 2.35 Hz; enucleated: 15.11 ± 2.35 Hz; P < 0.001, Wilcoxon rank-sum test), as well as median iTBF (intact: 19.68 ± 1.75 Hz; enucleated: 17.60 ± 1.75 Hz; P < 0.001, Wilcoxon rank-sum test; three asterisks correspond to P < 0.001). d, Top: tail angle traces of swimming episodes classified as forward (orange), left turns (magenta) and right turns (green) in one example experiment (1 fish, one recording, n = 311 bouts classified as 117 forward, 127 left turns, and 29 right turns; note that 38 bouts did not fall in any category and were discarded from further analysis). Bottom: tail curvature plots for example bouts of the three types. The curvature value of each segment (from rostral to caudal, in y) is represented in the color scale as a function of time (in x). e, Schematics of bout type decomposition into kinetic components. We assumed that a turn was composed of a directionality bend (steer component) executed in tandem with symmetric oscillating bends (forward component). f, Left: example volume image (as the average of multiple time steps) of a 6-dpf larval zebrafish after pipeline processing. Middle: position of example neurons (colored dots) among the population of all recorded V2a neurons (unfilled dots), in dorsal and sagittal views. Right: ΔF/F (colored trace) and inferred spike rate traces (gray) of the example neurons during several swim bouts. The periods during which the larva swam forward are shown as gray rectangles. ΔF/F and spike rate traces are represented as their z-score. g, Distribution of V2a neurons in a representative fish active during both forward bouts, left and right turns, corresponding to the forward component neurons (orange circles, 74 of 844 neurons, 8.9%). h, Distribution of V2a neurons for a representative fish active during left (pink, 327 of 844, 38.7%) or right turns (green, 223 out of 844, 26.4%) but not forward swim bouts. i, Density distribution of V2a neurons recruited for the forward or steering component (3 fish, median ± s.d.; forward component = 8.9 ± 3.2%; left steering component = 36.5 ± 1.5%; right steering component = 29.5 ± 4.5%).

Source data

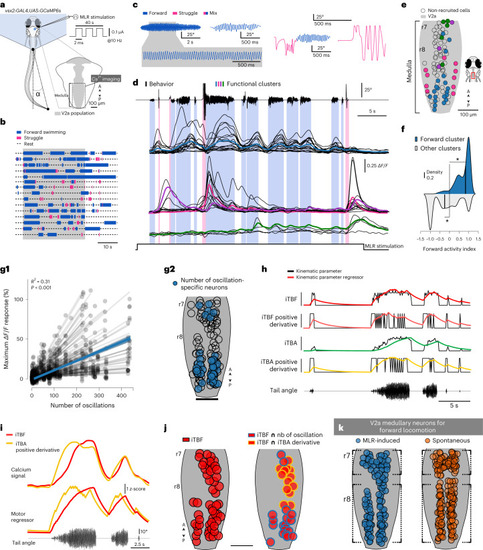
Medullary V2a RSNs are specifically recruited during MLR-induced forward swimming and encode the number of oscillations, TBF and amplitude.

a, Schematic illustration of the experiment investigating medullary V2a RSN recruitment during MLR-induced forward swimming. b, Representation of behavioral periods during all experiments investigated; the color depicts the behavior type (blue: forward episode; pink: escape or struggle). c, Example bouts elicited during a 40-s MLR stimulation corresponding to either pure forward swimming (top trace), bout of mixed episodes (bottom left) or pure escape or struggle. d, Tail angle trace and calcium activity of the functional clusters of medullary V2a RSNs active during locomotion for an example fish (mean activity in the color trace, individual traces in black). e, Location of neurons in the medulla in dorsal view, color-coded according to the functional cluster. The empty circles represent neurons not active. f, Medullary V2a RSNs in the forward clusters were recruited more during forward swimming than during struggle behavior. Forward activity index calculated from calcium activity as (forward activity index = average (maximum ΔF/F during forward episodes) − average (maximum ΔF/F during escape or struggle) / average (maximum ΔF/F during forward episodes) + average (maximum ΔF/F during escape or struggle)). A positive index indicates an average maximum ΔF/F higher during forward than during escape or struggle behavior (5 fish; forward cluster: 1,438 cells (mean ± s.d.): 0.71 ± 0.37, one-sided t-test against μ = 0; t(1,437) = 72 *P < 0.001; rest of the clusters: 2,603 cells: −0.17 ± 0.72, one sample t-test against μ = 0, t(6,626) = −12.6, *P < 0.001). g1, Linear regression between the maximum ΔF/F of individual V2a RSNs from the forward cluster and the number of oscillations of the forward episodes (n = 132 neurons in n = 5 fish, n = 8 trials; the gray lines represent the regression for individual neurons, the blue line the regression for all neurons). g2, Location of neurons in the forward cluster; in blue are the ones whose response amplitude correlated the most with the number of oscillations (blue filled circles, n = 38 of 132 neurons in n = 5 fish, n = 6 of 8 trials, P < 0.12 and correlation coefficient ≥ 0.8; uncolored circles represents the other neurons). h, Motor regressors encoding distinct kinematic parameters: the iTBF, the iTBA and their binary positive derivative. Raw trace (black) and corresponding regressor (color) of each motor feature. Bottom trace: corresponding tail angle. i, Top: Traces from two example neurons that were recruited during the forward episodes and whose calcium activity differed during the episode. Middle: two motor regressors that best recapitulated the calcium activity of the two neurons above (matching color codes). Bottom: corresponding tail angle trace. j, Left: subsets of V2a medullary RSNs encode the iTBF (n = 5 fish, n = 6 experiments, n = 59 of 89 neurons). Right: distribution of V2a RSNs whose activity encoded TBF and either an increase in TBA (yellow outline) or number of oscillations (blue outline, from g2). k, Activity map comparison of medullary V2a RSNs obtained during the forward component of spontaneous locomotion (Fig. 7) and MLR-induced forward locomotion (Fig. 8g2). Note the similarity of the forward-component clusters located in the rostral and caudal medulla (dotted brackets).

Source data

Acknowledgments
This image is the copyrighted work of the attributed author or publisher, and ZFIN has permission only to display this image to its users. Additional permissions should be obtained from the applicable author or publisher of the image. Full text @ Nat. Neurosci.