|
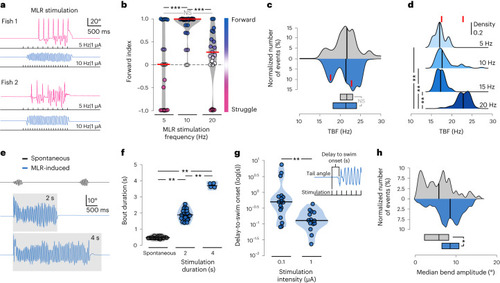
MLR stimulation parameters set the duration, time onset, amplitude and locomotor frequency of forward swimming a, Representative behavioral responses to MLR stimulation at different frequencies in two different larvae. b, Forward index for all the stimulation sites according to stimulation frequency (10 fish and 64 stimulation trials; 5 Hz: n = 19 stimulations, −0.06 ± 0.8; 10 Hz: n = 26 stimulations, 0.919 ± 0.24; 20 Hz: n = 19 stimulations, 0.27 ± 0.55 s; Kruskal–Wallis test, χ2 = 105.85, d.f. = 3, P < 0.001, two-sided Wilcoxon pairwise comparisons: 5 Hz versus 10 Hz: ***P < 0.001; 5 Hz versus 20 Hz: P = 0.17; 10 Hz versus 20 Hz: ***P < 0.001). P values were adjusted using the Bonferroni method. c, Distribution of median TBF on MLR stimulation (the red line represents the peaks of the distributions: 17.5 Hz and 23.2 Hz) compared to spontaneous locomotion (11 fish; spontaneous: 57 episodes, 21.6 ± 3.1 Hz; MLR stimulation: 242 episodes, 21.3 ± 2.9 Hz; Mann–Whitney U-test, W = 6,721, P = 0.7; the boxes at the bottom show the median and 25–75th quantiles). d, A 20-Hz MLR stimulation elicited swimming with higher TBF compared to lower stimulation frequency or spontaneous swimming (11 fish; 5 Hz: ten episodes, 17.54 ± 1.31 Hz; 10 Hz: 60 episodes, 18.7 ± 2.34 Hz; 15 Hz: 18 episodes, 17.66 ± 1.07 Hz; 20 Hz: 154 episodes, 23.1 ± 1.618 Hz; Kruskal–Wallis test, χ2 = 6237, d.f. = 31, P < 0.001, two-sided Wilcoxon pairwise comparisons: 5 Hz versus 10 Hz: P = 0.3; 5 Hz versus 15 Hz: P = 0.9; 5 Hz versus 20 Hz: P < 0.001; 10 Hz versus 15 Hz: P = 0.2; 10 Hz versus 20 Hz: P < 0.001; 15 Hz versus 20 Hz: P < 0.001). P values were adjusted using the Bonferroni method. The red lines depict the peak values for each of the distributions from c. e, Example tail angle traces for spontaneous forward swims (black, top trace) and forward swims induced by stimulating the MLR for 2 s (blue, middle trace) or 4 s (blue, bottom trace). The gray box indicates the duration of the train. f, Quantification of the duration of forward swims according to the duration of the MLR stimulation (10 Hz, 1 µA), displayed as a violin plot with the black line indicating the median value (8 fish; spontaneous: 27 episodes, 0.41 ± 0.15 s; 2-s stimulation: 19 episodes, 1.91 ± 0.44 s; 4-s stimulation: 4 episodes, 3.65 ± 0.315 s; Kruskal–Wallis test, χ2 = 38.6, d.f. = 2, **P < 0.001, Wilcoxon pairwise comparisons: spontaneous versus 2-s train stimulation, P < 0.001; spontaneous versus 4-s train stimulation, **P < 0.001; 2 s versus 4 s, **P < 0.001). g, Violin plot displaying the distribution of the delay to swim onset (the black line represents the median value) (9 fish; all MLR stimulation set at 10 Hz for 2 s; 0.1 µA: 17 episodes, 1.22 ± 1.97 s; 1 µA: 14 episodes, 0.15 ± 0.11 s; Mann–Whitney U-test, W = 199, *P < 0.001). h, MLR-evoked forward swims reliably exhibited larger TBA than spontaneous forward swims (12 fish; spontaneous: 67 episodes, 5.9 ± 3.16°; MLR stimulation: 172 episodes, 8.5 ± 3.8°; Mann–Whitney U-test, W = 8102, *P < 0.001). In all panels, the black line indicates the median value. Source data
|