|
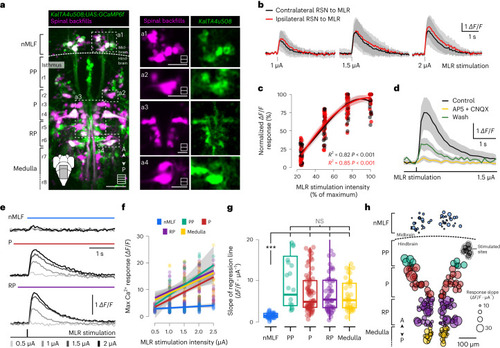
Unilateral MLR stimulation recruits ipsilateral and contralateral hindbrain RSNs but not the nMLF. a, Z-stack projection of ten optical sections acquired from 6-dpf Tg(KalTA4u508;UAS:GCaMP6f) larvae (green) with RSNs backfilled (magenta). Right: magnified images of the areas denoted in the left. Scales bars, 100 µm (left) and 50 µm (right). b, Average calcium response traces of hindbrain RSNs for one example fish in response to increasing MLR stimulation intensities (mean ± s.d., 18 neurons, grouped according to location of the electrode; red, ipsilateral; black, contralateral). c, Maximum calcium responses of RSNs pooled according to location either ipsilateral (red) or contralateral (black) relative to the stimulation electrode (5 fish, 53 neurons). Data followed a cubic polynomial function (ipsilateral: R2 = 0.85, F(112, 13.02) = 211.3, P < 0.001; contralateral: R2 = 0.82, F(100, 13.45) = 151.1, P < 0.001). d, Bath application of the glutamatergic antagonists CNQX (70 µM) and AP5 (70 µM) blocked the MLR-induced calcium responses of RSNs (2 fish, 72 cells, mean ± s.d.: 40-min drug incubation, 7.6 ± 2.6% of pre-drug application, after 180 min of washout 23 ± 8% of pre-drug application). e, Typical calcium transients of individual neurons in response to increasing intensity of MLR stimulations. f, Relationship between maximum calcium response amplitudes and MLR stimulation intensity for an example larva. Each dot represents a neuron. The linear correlation (line) was calculated for all the neurons in each defined region. g, Quantification of the slope reflecting the linear correlation between change of fluorescence and MLR stimulation intensity for all neurons tested. The box plots are depicted as the mean (center), first and third quartiles (lower and upper box limits), and minima and maxima (bottom and top whiskers) (9 fish, nMLF: 43 neurons, 0.74 ± 1.4 ΔF/F · µA−1; PP: 12 neurons, 7.8 ± 5.9 ΔF/F · µA−1; P: 72 neurons, 5.1 ± 4.7 ΔF/F · µA−1; RP: 52 neurons, 5.2 ± 5.7 ΔF/F · µA−1; medulla: 38 neurons, 4.2 ± 3.8 ΔF/F · µA−1; Kruskal–Wallis test, χ2 = 48.2, P < 0.001, Wilcoxon pairwise comparisons. P values were adjusted using the Bonferroni method: nMLF versus PP: P < 0.001; nMLF versus P: P < 0.001; nMLF versus RP: P < 0.001; nMLF versus medulla: P < 0.001; PP versus P: P = 0.26; PP versus RP: P = 0.26; PP versus medulla: P = 0.58; P versus RP: P = 0.91; P versus medulla: P = 0.58; RP versus medulla: P = 0.73). Three asterisks correspond to P < 0.001. h, Spatial distribution of RSN size coded using the slope plotted in g. MLR stimulation loci are displayed as gray dots. Source data
|