IMAGE

Fig. 2

ID
ZDB-IMAGE-231004-39
Source
Figures for Carbo-Tano et al., 2023
Image
Figure Caption

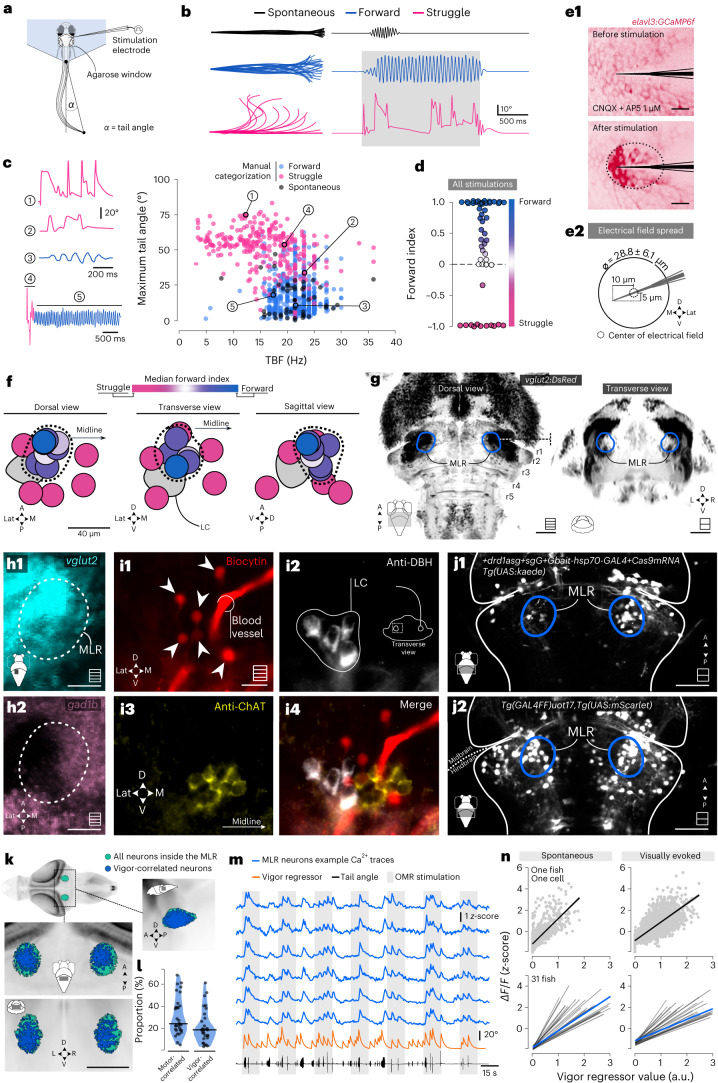
Fig. 2 Anatomical and functional description of the MLR in larval zebrafish reveals neurons triggering forward locomotion and encoding vigor.

a, Schematic illustration of the behavioral experiments with MLR stimulations. b, Typical behavioral responses shown as superimposed images of the larval zebrafish tail (left) and corresponding tail angle trace (right) of a spontaneous swim episode (black) and electrically evoked episodes corresponding to a forward swim (blue) or to a struggle (magenta). The gray bar indicates the stimulation duration. c, Left: representative example of tail angle traces. Right: maximum absolute tail angle versus median TBF of all locomotor episodes elicited by electrical stimulation classified as forward swims (blue) or struggles (magenta) (13 fish, 164 stimulations, 786 episodes). Spontaneous episodes are shown as black dots. d, Distribution of forward index for all simulations applied. e1, Calibration experiments where the fluorescence signal was used to evaluate the spread of the electrical field. Scale bars, 10 µm. e2, Scheme of the effective spread of the electrical field (5 fish, 3 electrodes, 10 stimulations). f, Location of all stimulation sites investigated color-coded using the median forward index. The dashed line represents the MLR location covering all stimulation sites with a median forward index above 0. g, Location of the MLR in larval zebrafish in reference to Tg(vglut2:DsRed) larvae of the mapzebrain atlas. Scale bars, 50 µm. Maximum projection Z-stacks are schematized in the bottom right corner with squares including multiple lines; single optical sections are schematized in the bottom right corner with squares including a single line. h, Z-stack projection of the MLR region in Tg(vglut2:DsRed) (h1) and Tg(gad1b:GFP) (h2) transgenic lines. Scale bars, 20 µm. i1i4, Distribution of retrogradely labeled MLR neurons (i1, red) in the vicinity of neurons immunoreactive to DBH (white) (i2) and ChAT (yellow) (i3,i4). This experiment was successfully replicated twice. j1, Midbrain and hindbrain region of 6-dpf Tg(UAS:kaede) larvae coinjected with the sgRNA targeting a cut site upstream of the drd1a locus. j2, Tg(UAS:mScarlet) expression pattern under the control of the Tg(GAL4FF)uot17 driver. Scale bars, 40 µm. k, Location of ROIs inside the MLR from n = 31 fish used for light sheet functional imaging. l, Violin plot showing the proportions of MLR neurons whose activity was correlated with motor activity (left) and MLR neurons whose activity was correlated with vigor of the bout (right) (the line is the median value). m, Example traces from vigor-correlated MLR neurons of larva exposed to OMR stimulation. n, Top: calcium activity of a representative vigor-correlated neuron in one fish plotted against the vigor regressor of the locomotor output for spontaneous (left) and visually evoked (right) swim bouts. Bottom: regression analysis for all 1,235 vigor-correlated MLR neurons for all 31 fish for spontaneous (left) and visually evoked (right) swim bouts. Each black line represents the correlation per fish of all vigor-correlated neurons in the MLR locus. The blue line represents the correlation of all 1,235 vigor-correlated MLR neurons across the 31 fish. A, anterior; P, posterior; D, dorsal; V, ventral; L, left; R, right; M, medial; Lat, lateral.

Source data

Acknowledgments
This image is the copyrighted work of the attributed author or publisher, and ZFIN has permission only to display this image to its users. Additional permissions should be obtained from the applicable author or publisher of the image. Full text @ Nat. Neurosci.