
- Title
-
Analysis of Potential Non-Canonical or Alternate STAT5 Functions in Immune Development and Growth
- Authors
- Awasthi, N., Ward, A.C., Liongue, C.
- Source
- Full text @ Front Biosci (Landmark Ed)
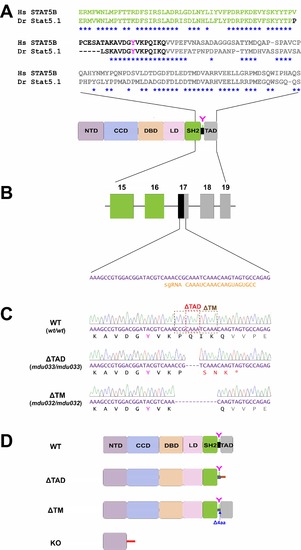
Generation of zebrafish Stat5.1 mutants using CRISPR/Cas9. (A) Schematic diagram of STAT5B/Stat5.1 and its constituent N-terminal domain (NTD), coiled-coil domain (CCD), DNA-binding domain (DBD), linker domain (LD), Src-homology 2 domain (SH2), tyrosine residue (Y), and transactivation domain (TAD). An amino acid alignment for the indicated region of Homo sapiens (Hs) STAT5B and Danio rerio (Dr) Stat5.1 is shown above, with identical residues indicated by asterisks. (B) Part of the zebrafish stat5.1 gene. Exons are shown as boxes in color matching the corresponding domain, along with the sequence targeted by the sgRNA. (C) Sequence traces, corresponding nucleotides, and encoded amino acids for homozygous wild-type (WT) (wt/wt), Δ TAD (mdu033/mdu033) and Δ TM (mdu032/mdu032) Stat5.1. The dotted boxes on the WT trace indicate the sequences deleted for the specified mutant. The mdu033 allele represents a 4 bp deletion leading to an altered reading frame after P701 that results in 3 de novo residues followed by a stop codon (shown in red), whereas the mdu032 allele denotes a 12 bp in-frame deletion that results in the removal of 4 residues after K700 with all remaining C-terminal sequences intact. (D) Schematic representation of Stat5.1 WT along with the Δ TAD, Δ TM, and KO (mdu022/mdu022) mutants. |
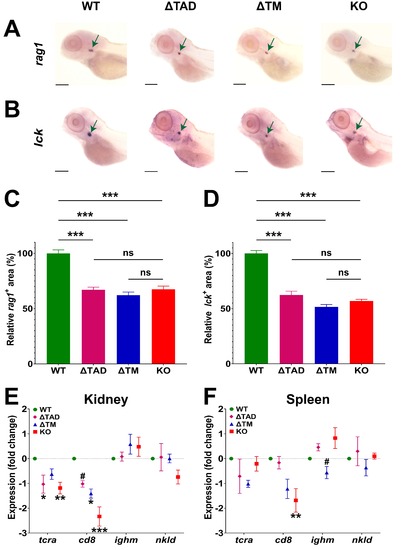
Analysis of lymphopoiesis in Stat5.1 mutants. (A–D) Expression analysis of lymphoid markers using Whole-mount in situ hybridization (WISH) in 5 dpf WT (stat5.1 ), deleted transactivation domain ( TAD) (stat5.1 ), TM (stat5.1 ) and knockout (KO) (stat5.1 ) embryos showing representative individuals for rag1 (A) and lck (B). Green arrows indicate the thymic region and 0.5 mm scale bars are shown. The relative area of expression for rag1 (C) and lck (D) was quantified comparative to the WT that was set at 100%, with mean and standard error of the mean (SEM) (n = 25–30) displayed. (E,F) Expression analysis of representative lymphoid marker genes by quantitative real-time reverse-transcription polymerase chain reaction (qRT -PCR) in the kidney (E) and spleen (F) from adult male fish of the indicated genotypes. Primary data were normalized relative to actb and represented as fold-change showing mean and SEM (n = 5). For panels (C–F), the level of statistical significance is indicated. *: p 0.05, **: p 0.01, ***: p 0.001 compared to WT; #: p 0.05 compared to KO; ns: not significant. |
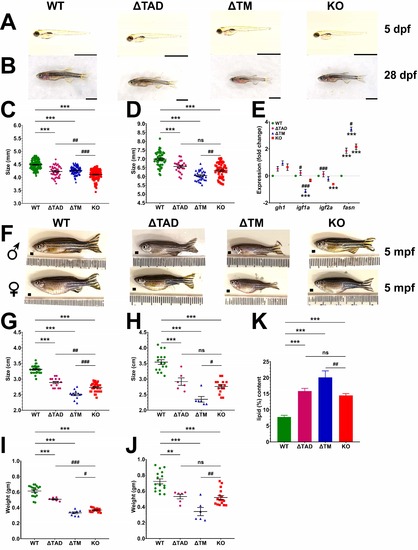
Analysis of growth and adiposity in Stat5.1 mutants. (A–B, F) Images of representative WT (stat5.1 ), TAD (stat5.1 ), TM (stat5.1 ), and KO (stat5.1 ) individuals at 5 dpf (A), 28 dpf (B), and 5 mpf for male (♂) and female (♀) adults (F). Scale bars represent 2 mm in panels (A) and (B), with ruler increments of 1 mm in panel (F). (C,D,G–J) Analysis of size for fish with the indicated genotypes, showing quantitation of length at 5 dpf (C), 28 (D) and 5 mpf for male (G) and female (H) fish, and weight at 5 mpf for male (I) and female (J) fish of the indicated genotypes showing mean and SEM (5 dpf: n = 90–150; 28 dpf: n = 30–45; 5 mpf: n = 6–15) (J,K). (E) Expression analysis of the indicated genes involved in growth and lipid biosynthesis by qRT -PCR in 28 dpf WT, TAD, TM, and KO juveniles. Data were normalized relative to the actb and represented as relative fold-change showing mean and SEM (n = 5). (K) Quantitation of total lipid content for WT, TAD, TM, and KO of 5 mpf adult females each, represented as a percentage of wet weight showing mean and SEM (n = 6). For panels (C–E), (G,H), and (I,J) the level of statistical significance is indicated. **: p 0.01, ***: p 0.001 compared to WT; #: p 0.05, ##: p 0.01, ###: p 0.001 compared to KO; ns: not significant. EXPRESSION / LABELING:
PHENOTYPE:
|