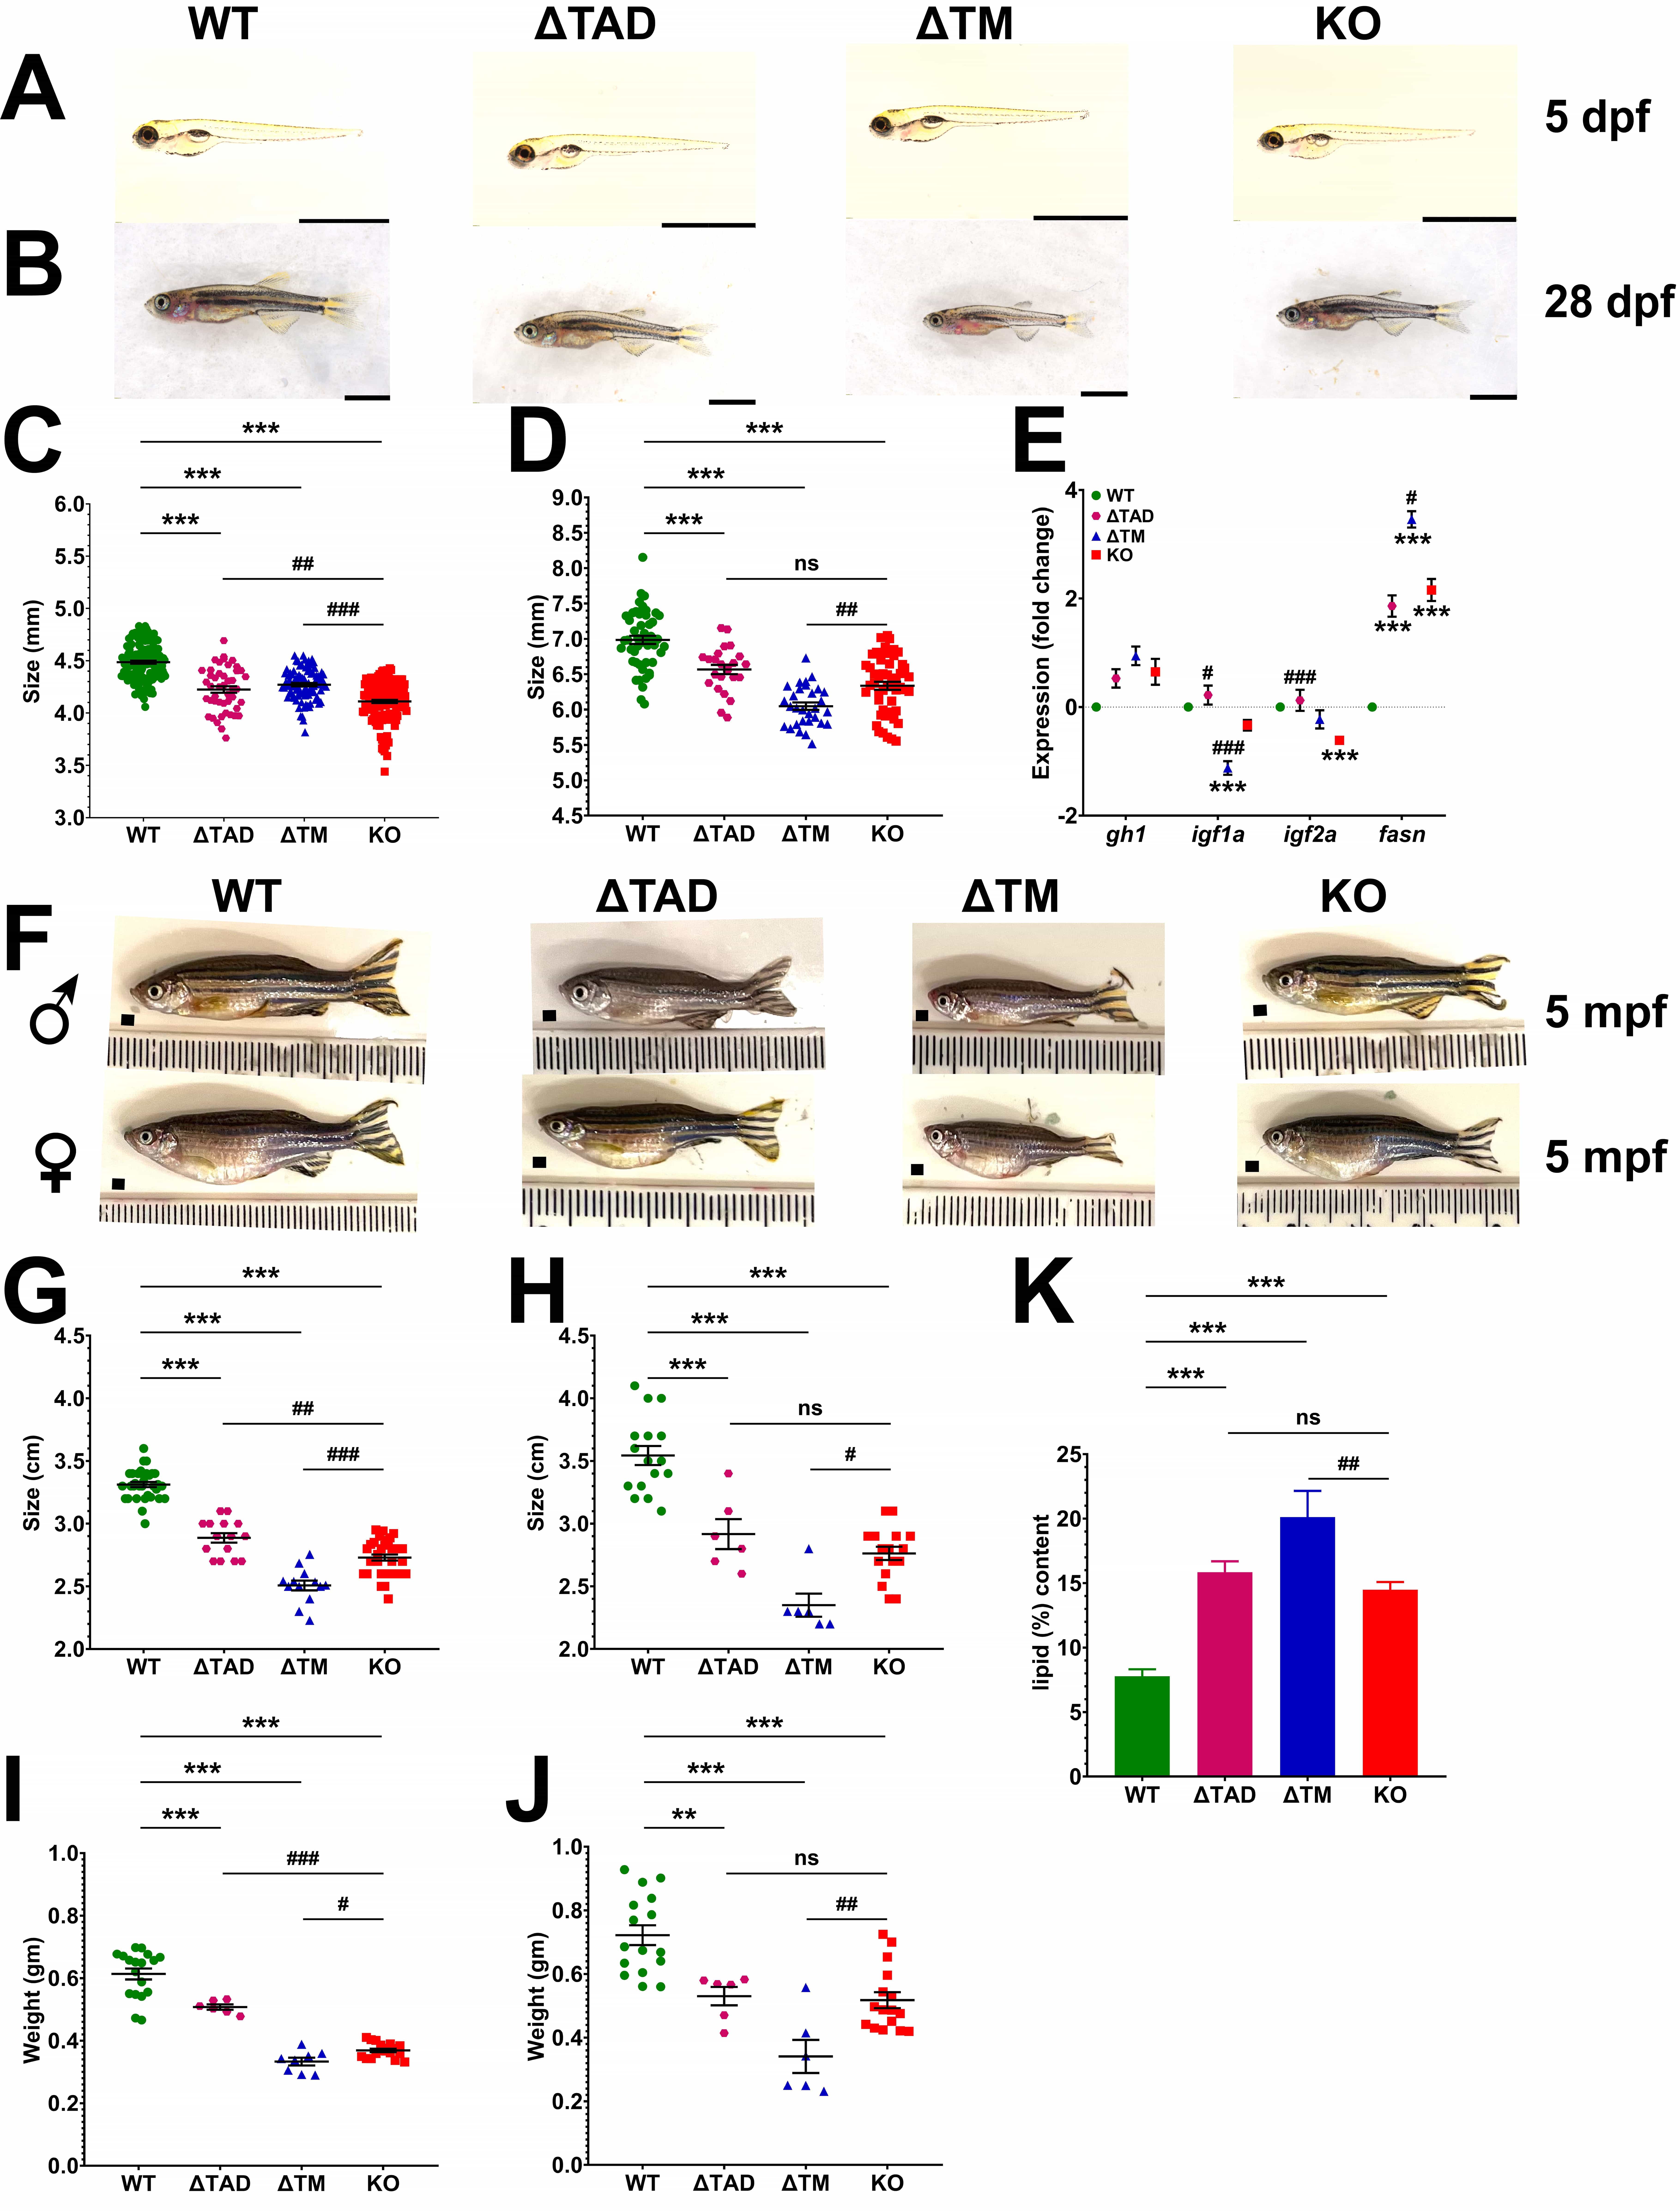
Fig. 3 Analysis of growth and adiposity in Stat5.1 mutants. (A–B, F) Images of representative WT (stat5.1 ), TAD (stat5.1 ), TM (stat5.1 ), and KO (stat5.1 ) individuals at 5 dpf (A), 28 dpf (B), and 5 mpf for male (♂) and female (♀) adults (F). Scale bars represent 2 mm in panels (A) and (B), with ruler increments of 1 mm in panel (F). (C,D,G–J) Analysis of size for fish with the indicated genotypes, showing quantitation of length at 5 dpf (C), 28 (D) and 5 mpf for male (G) and female (H) fish, and weight at 5 mpf for male (I) and female (J) fish of the indicated genotypes showing mean and SEM (5 dpf: n = 90–150; 28 dpf: n = 30–45; 5 mpf: n = 6–15) (J,K). (E) Expression analysis of the indicated genes involved in growth and lipid biosynthesis by qRT -PCR in 28 dpf WT, TAD, TM, and KO juveniles. Data were normalized relative to the actb and represented as relative fold-change showing mean and SEM (n = 5). (K) Quantitation of total lipid content for WT, TAD, TM, and KO of 5 mpf adult females each, represented as a percentage of wet weight showing mean and SEM (n = 6). For panels (C–E), (G,H), and (I,J) the level of statistical significance is indicated. **: p 0.01, ***: p 0.001 compared to WT; #: p 0.05, ##: p 0.01, ###: p 0.001 compared to KO; ns: not significant.
Image
Figure Caption
Figure Data
Acknowledgments
This image is the copyrighted work of the attributed author or publisher, and
ZFIN has permission only to display this image to its users.
Additional permissions should be obtained from the applicable author or publisher of the image.
Full text @ Front Biosci (Landmark Ed)

