FIGURE SUMMARY
Title

Glucocorticoid receptor-induced non-muscle caldesmon regulates metastasis in castration-resistant prostate cancer

Authors
Virtanen, V., Paunu, K., Kukkula, A., Niva, S., Junila, Y., Toriseva, M., Jokilehto, T., Mäkelä, S., Huhtaniemi, R., Poutanen, M., Paatero, I., Sundvall, M.
Source
Full text @ Oncogenesis

l-CaD is expressed in PCa cell lines, and CALD1 co-expresses with positive regulators of EMT in PCa patient data sets.

A Western blot depicting l-CaD protein expression in commercial PCa cell lines. B Barplots representing CALD1 mRNA expression data in PCa cell lines acquired from Cancer Cell Line Encyclopedia. C Frequency of CALD1 alterations in publicly available PCa patient data sets containing CALD1 mutation and copy number alteration data [6778]. D Representative Western blot depicting l-CaD expression and barplot depicting pooled densitometry of Western blot bands from three biological repeats after 72 h of 5% CSS culture and 24 h DHT treatment. E Venn diagram showing the concordance of top 1000 mRNAs co-expressed with CALD1 between PCa patient data sets available on cBioPortal. F List of concordant hits of mRNA co-expression with CALD1. G MSigDB (version 7.5) hallmark gene sets that significantly overlap and ten MSigDB GO:BP gene sets with the highest percentage of overlap with the list of mRNA concordantly co-expressed with CALD1.

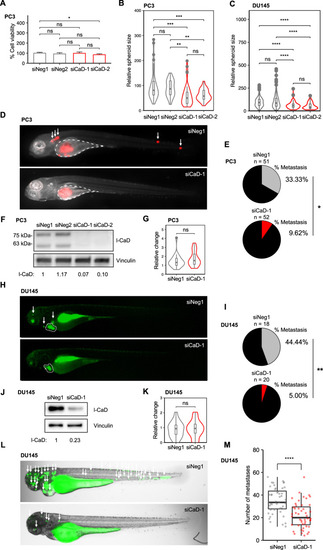
Loss of l-CaD impairs metastasis and invasion of PCa cells.

A Barplot representing viability in PC3 cells transfected with siNeg1, siNeg2, siCaD-1, or siCaD-2. The mean and standard deviation (SD) of three experiments are shown (ns = not significant and *p < 0.05 as determined by the Mann–Whitney–Wilcoxon two-sided test). B Violin plot of relative spheroid size in PC3 cells (n = 160) transfected with siNeg1, siNeg2, siCaD-1, or siCaD-2 and grown in 3D basement membrane matrix culture. Boxplot indicates median and whiskers indicate 1.5 times interquartile range pooled from three experiments (ns = not significant, **p < 0.01, and ***p < 0.001 as determined by t-test). C Violin plot of relative spheroid size in DU145 cells (n = 527) transfected with siNeg1, siNeg2, siCaD-1, or siCaD-2 and grown in 3D basement membrane matrix culture. Boxplot indicates median and whiskers indicate 1.5 times interquartile range pooled from three experiments (ns = not significant, **p < 0.01, and ***p < 0.001 as determined by t-test). D Representative fluorescent merge images of zebrafish embryos 4 days after yolk sac microinjection of mCherry PC3 cells transfected with siNeg1 or siCaD-1. The injection site is highlighted in white. Metastases are indicated with arrows. E Pie chart showing the percentage of zebrafish embryos with visible metastases 4 days after injection pooled from three experiments (*p < 0.05 as analyzed by Fisher’s exact test). F Western blot depicting expression levels of l-CaD in mCherry PC3 cells transfected with siNeg1, siNeg2, siCaD-1, or siCaD-2 48 h after transfection. G Representative violin plots of relative change in primary tumor size (size 4 days after injection / size 1 day after injection). The tumor area was measured from fluorescent images of zebrafish. Boxplot indicates median, and whiskers indicate 1.5 times interquartile range (ns = not significant as determined by t-test). H Representative fluorescent images of zebrafish embryos 4 days after pericardial microinjection of CellTracker Green labeled DU145 cells transfected with siNeg1 or siCaD-1. The primary tumor is highlighted in white. Metastases are indicated with arrows. I Pie chart showing the percentage of zebrafish embryos with visible metastases 4 days after injection to the pericardial cavity (**p < 0.01 as analyzed by Fisher’s exact test). J Western blot depicting expression levels of l-CaD in DU145 cells transfected with siNeg1 or siCaD-1 48 h after transfection. K Violin plots of relative change in primary tumor size (size 4 days after injection/size 1 day after injection). The tumor area was measured from fluorescent images of zebrafish. Boxplot indicates median, and whiskers indicate 1.5 times interquartile range (ns = not significant as determined by t-test). L Representative brightfield and fluorescent merge images of zebrafish embryos 1 day after microinjection of CellTracker Green labeled DU145 cells transfected with siNeg1 or siCaD-1 to the common cardinal vein. Metastases are indicated with arrows. M Box and jitter plots depicting the number of metastases in zebrafish embryos (n = 96). Boxplot indicates median, and whiskers indicate 1.5 times interquartile range (****p < 0.0001 as determined by t-test).

l-CaD expression is upregulated by GR activation promoting growth in organotypic cell culture.

A Correlation between GR and CALD1 mRNA in patient-derived organoids (cBioPortal) [79]. B Western blot depicting GR expression in commercial PCa cell lines. C UCSC genome browser visualization of ReMap ChIP-seq tracks for AR and GR in CALD1 with ENCODE candidate promoter-like signatures highlighted in red and enhancer-like signatures highlighted in yellow and orange. D Barplots depicting l-CaD protein expression in PC3 cells treated with Dex (0.1 µM, 1 µM, or 10 µM) after 24 or 48 hours. The mean and SD of three experiments are shown (ns = not significant, *p < 0.05, and ****p < 0.0001 as determined by t-test). E Barplots depicting l-CaD protein expression in DU145 cells treated with Dex (0.1 µM, 1 µM, or 10 µM) after 24 or 48 hours. The mean and SD of three experiments are shown (ns = not significant, *p < 0.05, and ****p < 0.0001 as determined by t-test). F Barplots depicting l-CaD protein expression in DU145 cells treated with prednisolone (0.1 µM, 1 µM, or 10 µM) after 48 hours. The mean and SD of three experiments are shown (ns = not significant and *p < 0.05 as determined by t-test). G Violin plots of relative spheroid size in PC3 cells transfected with siNeg1 or siCaD-1 and grown in the presence or absence of 1 µM Dex in basement membrane matrix. Boxplot indicates median and whiskers indicate 1.5 times interquartile range pooled form three experiments (ns = not significant, *p < 0.05, and **p < 0.01 as determined by t-test). H Representative brightfield image of day 5 organotypic culture of PC3 cells treated with siNeg-1 or siCaD-1 and exposed to 1 µM Dex or vehicle (DMSO) on day 3 of culture in basement membrane matrix.

l-CaD colocalizes with actin in filopodia, and the knockdown of l-CaD downregulates N-cadherin

A Representative fluorescent merge images of PC3 cells transfected with siNeg1 or siCaD-1 and stained with antibodies recognizing actin and l-CaD. The lower row shows separate images of actin, l-CaD, and merge in a close-up of the upper siNeg1 image. B Representative fluorescent images of PC3 spheroids transfected with siNeg1, siNeg2, or siCaD-1, stained with N-cadherin, and counterstained with DAPI. C Barplots depicting N-cadherin protein intensity in spheroids formed by transfected PC3 cells shown in B. Average was calculated from multiple individual spheroids (N = 22) measured for mean intensity. The mean and SD are shown (ns = not significant, *p < 0.05, and **p < 0.01 as determined by t-test). D Representative fluorescent images of DU145 spheroids transfected with siNeg1, siNeg2, siCaD-1, or siCaD-2 stained against N-cadherin. E Barplots depicting N-cadherin protein intensity in spheroids formed by transfected DU145 cells shown in D. Average was calculated from multiple individual spheroids (N = 30) measured for mean intensity. The mean and SD shown (ns = not significant, ***p < 0.001, and ****p < 0.0001 as determined by t-test). F Representative fluorescent images of DU145 spheroids transfected with siNeg1, siNeg2, siCaD-1, or siCaD-2 stained against ZEB1. G Barplots depicting ZEB1 protein intensity in spheroids formed by transfected DU145 cells shown in F. Average was calculated from multiple individual spheroids (N = 58) measured for mean intensity. The mean and SD shown (ns = not significant, **p < 0.001, ***p < 0.001, and ****p < 0.0001 as determined by t-test).

l-CaD expression is upregulated during enzalutamide resistance in vivo.

A Representative Western blot depicting l-CaD expression and barplot depicting pooled densitometry of Western blot bands from three biological repeats after treatment with enzalutamide (5 days, 10 µM) and Dex (24 h, 0.1 µM). B Scatterplots depicting Pearson correlation between CALD1 and GR or KRT8 mRNA from enzalutamide-treated VCaP xenograft mice. C IHC of l-CaD in castration-resistant VCaP xenografts during enzalutamide response (left) and after attained enzalutamide resistance (right). Individual mice are denoted using Roman numerals. D IHC of GR in castration-resistant VCaP xenografts during enzalutamide response (left) and after attained enzalutamide resistance (right). Individual mice are denoted using Roman numerals. E IHC of l-CaD and GR from adjacent slices of VCaP xenograft tumors in mice during apalutamide resistance. The lower row shows a higher magnification image of the area highlighted on the upper row. Individual mice are denoted using Greek letters. F Scatterplots depicting Pearson correlation between CALD1 and GR or KRT8 mRNA from vehicle-, enzalutamide-, and apalutamide-treated VCaP xenograft mice. G Western blot of vehicle- and apalutamide-treated castration-resistant VCaP xenografts. Quantification of the GR and l-CaD signal relative to actin loading control signal and the average vehicle-treated signal is shown below.

Acknowledgments
This image is the copyrighted work of the attributed author or publisher, and ZFIN has permission only to display this image to its users. Additional permissions should be obtained from the applicable author or publisher of the image. Full text @ Oncogenesis