|
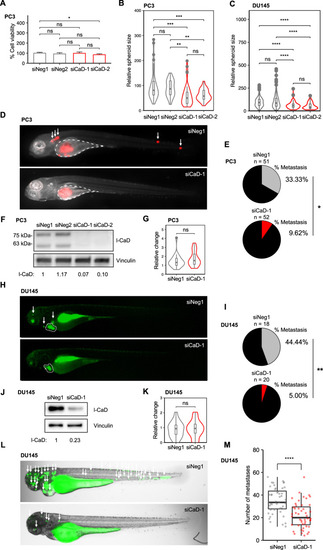
Loss of l-CaD impairs metastasis and invasion of PCa cells. A Barplot representing viability in PC3 cells transfected with siNeg1, siNeg2, siCaD-1, or siCaD-2. The mean and standard deviation (SD) of three experiments are shown (ns = not significant and *p < 0.05 as determined by the Mann–Whitney–Wilcoxon two-sided test). B Violin plot of relative spheroid size in PC3 cells (n = 160) transfected with siNeg1, siNeg2, siCaD-1, or siCaD-2 and grown in 3D basement membrane matrix culture. Boxplot indicates median and whiskers indicate 1.5 times interquartile range pooled from three experiments (ns = not significant, **p < 0.01, and ***p < 0.001 as determined by t-test). C Violin plot of relative spheroid size in DU145 cells (n = 527) transfected with siNeg1, siNeg2, siCaD-1, or siCaD-2 and grown in 3D basement membrane matrix culture. Boxplot indicates median and whiskers indicate 1.5 times interquartile range pooled from three experiments (ns = not significant, **p < 0.01, and ***p < 0.001 as determined by t-test). D Representative fluorescent merge images of zebrafish embryos 4 days after yolk sac microinjection of mCherry PC3 cells transfected with siNeg1 or siCaD-1. The injection site is highlighted in white. Metastases are indicated with arrows. E Pie chart showing the percentage of zebrafish embryos with visible metastases 4 days after injection pooled from three experiments (*p < 0.05 as analyzed by Fisher’s exact test). F Western blot depicting expression levels of l-CaD in mCherry PC3 cells transfected with siNeg1, siNeg2, siCaD-1, or siCaD-2 48 h after transfection. G Representative violin plots of relative change in primary tumor size (size 4 days after injection / size 1 day after injection). The tumor area was measured from fluorescent images of zebrafish. Boxplot indicates median, and whiskers indicate 1.5 times interquartile range (ns = not significant as determined by t-test). H Representative fluorescent images of zebrafish embryos 4 days after pericardial microinjection of CellTracker Green labeled DU145 cells transfected with siNeg1 or siCaD-1. The primary tumor is highlighted in white. Metastases are indicated with arrows. I Pie chart showing the percentage of zebrafish embryos with visible metastases 4 days after injection to the pericardial cavity (**p < 0.01 as analyzed by Fisher’s exact test). J Western blot depicting expression levels of l-CaD in DU145 cells transfected with siNeg1 or siCaD-1 48 h after transfection. K Violin plots of relative change in primary tumor size (size 4 days after injection/size 1 day after injection). The tumor area was measured from fluorescent images of zebrafish. Boxplot indicates median, and whiskers indicate 1.5 times interquartile range (ns = not significant as determined by t-test). L Representative brightfield and fluorescent merge images of zebrafish embryos 1 day after microinjection of CellTracker Green labeled DU145 cells transfected with siNeg1 or siCaD-1 to the common cardinal vein. Metastases are indicated with arrows. M Box and jitter plots depicting the number of metastases in zebrafish embryos (n = 96). Boxplot indicates median, and whiskers indicate 1.5 times interquartile range (****p < 0.0001 as determined by t-test).
|