FIGURE SUMMARY
Title

Human Mutated MYOT and CRYAB Genes Cause a Myopathic Phenotype in Zebrafish

Authors
Cannone, E., Guglielmi, V., Marchetto, G., Tobia, C., Gnutti, B., Cisterna, B., Tonin, P., Barbon, A., Vattemi, G., Schiavone, M.
Source
Full text @ Int. J. Mol. Sci.

Light microscopy of the muscle biopsy from control subject (AC) and patient with p.Gly154Ser CRYAB mutation (DF). No morphological abnormalities with haematoxylin and eosin (A), modified Gomori trichrome (B) and NADH (C) staining in control subject. Haematoxylin and eosin (D) staining shows fiber size variation in MFM patient. Muscle fibers with amorphous material that stains eosinophilic on haematoxylin and eosin (D) and dark blue on modified Gomori trichrome (E) are also observed (arrows); these fibers have irregular focal areas of decreased or increased NADH staining (F) (arrows). Images were obtained with obj ×20. Scale bar: 50 μm.

Immunofluorescence staining of the muscle biopsy from control subject and patient with p.Gly154Ser CRYAB mutation. Panels (AC) (control), Panels (DF) (patient). No focal areas of increased reactivity for αB-crystallin (Panel (A), green), desmin (Panel (B), green) and myotilin (Panel (C), green) in muscle fibers of control muscle. Focal accumulation of αB-crystallin (Panel (D), green), desmin (Panel (E), green) and myotilin (Panel (F), green) in two fibers of patient’s muscle biopsy. The percentage of fibers with aggregates is less than 15% of the total muscle fibers, and the percentage of the fiber area occupied by aggregates in the sections analyzed is 10.03 ± 2.15 for αB-crystallin, 5.78 ± 1.30 for desmin and 10.25 ± 0.81 for myotilin of the total muscle fiber area in this patient. Maackia amurensis lectin-II (MAL-II) staining (Panels (AF), red) depicts the sarcolemma of muscle fibers. Images were obtained with obj ×20.

Transmission electron micrographs of the muscle biopsy from control subject (A) and patient with p. Arg259Cys MYOT mutation (B). Normal muscle sarcomeres in muscle of control subject (A). An abnormal fiber region showing myofibrillar disruption and streaming of Z-disk in patient (B). Scale bar: 500 nm.

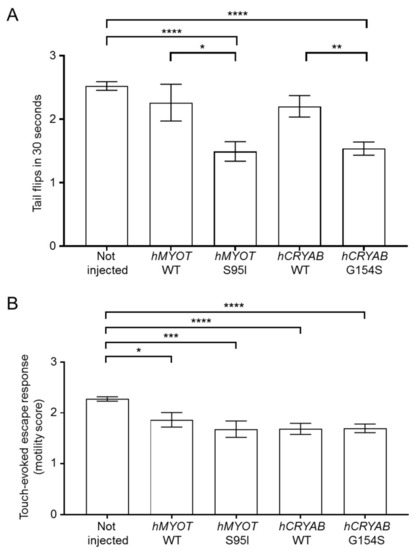
Effects on zebrafish motor behavior of both wildtype and mutant hMYOT and hCRYAB genes. (A). Tail flips. Spontaneous coiling events (tail flips) performed by wildtype zebrafish (not injected or injected with 25 µM of tol2 expression plasmid harboring hMYOT WT, hMYOT S95I, hCRYAB WT, hCRYAB G154S cDNA sequences) were recorded at 24 hpf. Graph bars represent the media of tail flips performed by each embryo in 30 s ± s.e.m. (B). Touch-evoked escape response was measured at 48 hpf on the same embryos reported in (A). A value of 0 was attributed to completely paralyzed embryos, 1 to embryos performing only spontaneous coiling events, 2 to embryos moving short distances, and 3 to embryos swimming normally. Graph bars represent the media of motor value for each condition ± s.e.m. Values in (A,B) represent the media from 4 independent experiments. Number of embryos analyzed for (A): not injected (n = 330), hMYOT WT (n = 50), hMYOT S95I (n = 59), hCRYAB WT (n = 109), hCRYAB G154S (n = 168). Number of embryos analyzed in (B): not injected (n = 342), hMYOT WT (n = 66), hMYOT S95I (n = 50), hCRYAB WT (n = 108), hCRYAB G154S (n = 148). p values were calculated by using One-way ANOVA with Bonferroni correction. * p < 0.05; ** p < 0.01; *** p < 0.001; **** p < 0.0001.

Effects on muscle fiber structure and development of both wildtype and mutant hMYOT and hCRYAB genes. (A). Birefringence analysis of zebrafish embryos at 48 hpf. Left panels in (A) show representative birefringence images of embryos for each analyzed condition. Scale bar is 200 μm. Total number of embryos analyzed for each condition: not injected wildtype embryos (n = 199), injected embryos with hMYOT WT (n = 35), hMYOT S95I (n = 41), hCRYAB WT (n = 87), hCRYAB G154S (n = 92). Right panel in (A) shows the bar graph reporting the percentage of birefringence phenotypes for each analyzed condition. By considering 100% as the total number of embryos analyzed for each condition, the white open bars represent the percentage of embryos with normal birefringence phenotype, while the closed black bars represent the percentage of severe birefringence phenotype. Three independent experiments have been performed. (B). The involvement of BMP signaling pathway in muscle structure development was evaluated by checking GFP fluorescence of Tg(BMPRE:EGFP)ia18 zebrafish embryos at 48hpf not injected (n = 127) or injected with hMYOT WT (n = 32), hMYOT S95I (n = 57), hCRYAB WT (n = 68), hCRYAB G154S (n = 98). Left panels in (B) show representative images of fluorescent embryos for each analyzed condition. Scale bar is 200 μM. Right panel in (B) shows the bar graph reporting the integrated density of fluorescent pixel area in the trunk region ± s.e.m.. Four independent experiments were performed. * p < 0.05, ** p < 0.01, *** p < 0.001 according to One-way ANOVA test with Bonferroni correction.

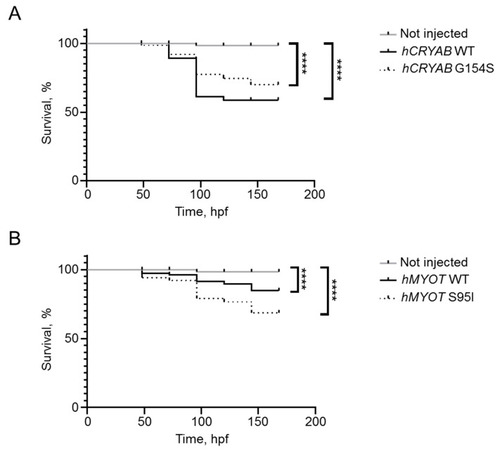
Effects on fish survival of both wildtype and mutant hCRYAB (A) and hMYOT (B) genes. Kaplan–Meier analysis was performed to observe the number of survived fish up to 7 dpf. Graphs in (A,B) reported the percentage of survived embryos after 4 experiments. Number of fish in (A,B): not injected (n = 112); hCRYAB WT (n = 63); hCRYAB G154S (n = 111); hMYOT WT (n = 73); hMYOT S95I (n = 79) of injected fish. **** p < 0.0001 according to non-parametric Wilcoxon-Mann–Whitney test.

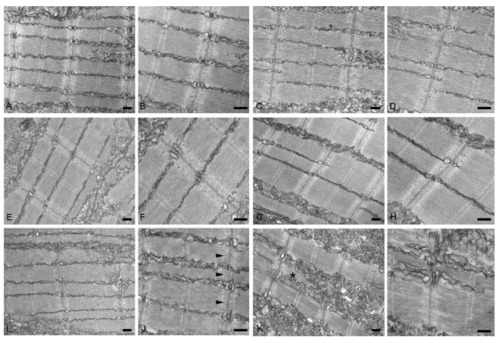
Transmission electron micrographs of no-injected (A,B) or injected with vehicle (C,D), hMYOT WT (E,F), hCRYAB WT (G,H), hMYOT S95I (I,J), hCRYAB G154S (K,L). In non-injected wildtype embryos or injected embryos with vehicle or wildtype genes muscle fibers show normal sarcomere structure with highly organized and well-aligned thick and thin myofilaments flanked by Z-disks. By contrast, embryos injected with hMYOT S95I sarcomeres showed abnormalities of Z-disk (black arrowheads in panel (J)), which appears irregular with its extension into I band. Large areas depleted of myofilaments, stressed fiber-like structures (black asterisk in panel (K)) and reduced density of the sarcomeric myofilaments were observed in myofibers of hCRYAB G154S injected embryos. Scale bar, 200 nm.

Whole-mount immunofluorescence shows highly fluorescent dots in zebrafish embryos injected with both wt and mutated hCRYAB and hMYOT. Whole-mount immunofluorescence analysis with specific myotilin and αb-crystallin antibodies was performed at 48 hpf, and images of muscle fibers in the trunk region were acquired with Axiozoom.V16 fluorescent stereomicroscope equipped with Axiocamera 506 (Zeiss International, Oberkochen, Germany). In (A,B), representative full Z-stack brightfield and fluorescent images are reported for zebrafish wildtype embryos not injected (aa″ in A,B) or injected with hMYOT WT (bb″ in A), hMYOT S95I (cc″ in A), hCRYAB WT (bb″ in B), hCRYAB G154S (cc″ in B). Panels (a″, b″ and c″) both in (A,B) represent zoomed images from panels (a, b and c), respectively. Scale bar is 500 μm for (a,a′,b,b′,c,c′) panels and 100 μm for (a″,b″,c″) panels. Highly fluorescent dots of different shapes and sizes (white arrows) are indicated. (C). Bar graphs report the percentage of fish showing highly fluorescent dots (black closed bars). White open bars represent fish showing no fluorescent dots. Three independent experimental analyses have been performed. Total number of embryos analyzed for each experimental condition: wildtype not injected (n = 30 in (A) and left panel in (C); n = 35 in (B) and right panel in (C)), hMYOT WT (n = 30), hMYOT S95I (n = 56), hCRYAB WT (n = 20), hCRYAB G154S (n = 26).

Lightsheet microscopy shows highly fluorescent dots in zebrafish embryos injected with both wt and mutated hCRYAB and hMYOT. Whole-mount immunofluorescence analysis with specific myotilin and αb-crystallin antibodies was performed at 48 hpf, and images of muscle fibers in the trunk region were acquired with a Lightsheet Z1 microscope (Zeiss International, Oberkochen, Germany). Images are Maximum Intensity Projections of selected planes for zebrafish wildtype embryos not injected (A,D,D′) or injected with hMYOT WT (B,B′), hMYOT S95I (C,C′,C″), hCRYAB WT (E,E′), hCRYAB G154S (F,F′). Total number of embryos analyzed for each experimental condition n = 3. Three independent experimental analyses have been performed. Panels (B′,C′,C″,D′,E′,F′) represent zoomed images from panels (B,C,D,E,F), respectively. Scale bar is 50 μm for (AF) panels and 20 μm for (B′,C′,C″,D′,E′,F′) panels. Highly fluorescent dots variable in shape and size (black and white arrows), extended myotendinous junction (grey arrow in (F)) and deranged muscle fibers (large gray head arrow in (F)) are indicated.

Acknowledgments
This image is the copyrighted work of the attributed author or publisher, and ZFIN has permission only to display this image to its users. Additional permissions should be obtained from the applicable author or publisher of the image. Full text @ Int. J. Mol. Sci.