
- Title
-
Altered glucocorticoid reactivity and behavioral phenotype in rx3-/- larval zebrafish
- Authors
- Herget, U., Ryu, S., De Marco, R.J.
- Source
- Full text @ Front Endocrinol (Lausanne)
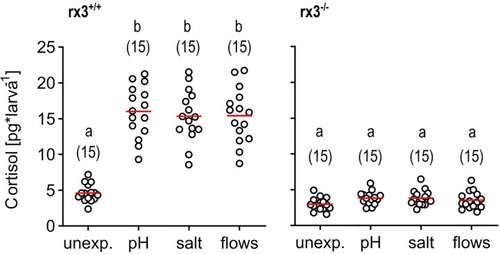
Glucocorticoid reactivity in rx3+/+ and rx3-/- zebrafish larvae. Whole-body cortisol in rx3+/+ (left) and rx3-/- (right) larvae (all data points shown, mean in red, sample size in parentheses) after exposure to a pH drop (pH), hyperosmotic medium (salt) or stress-evoking fast water flows (flows). Baseline levels are those of control (unexposed) larvae (unexp.), which were equally handled, omitting stressor exposure. Letters indicate results of Bonferroni’s tests (p < 0.001) after one-way ANOVAs (left, rx3+/+: F(3,59)=42.8, p < 0.0001, right, rx3-/-: F(3,59)=2.7, p = 0.1), followed by post hoc comparisons. |
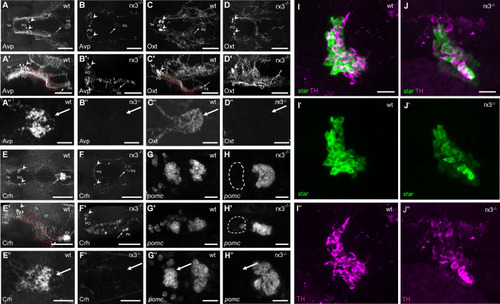
HPI axis elements in rx3+/+ and rx3-/- zebrafish larvae. |
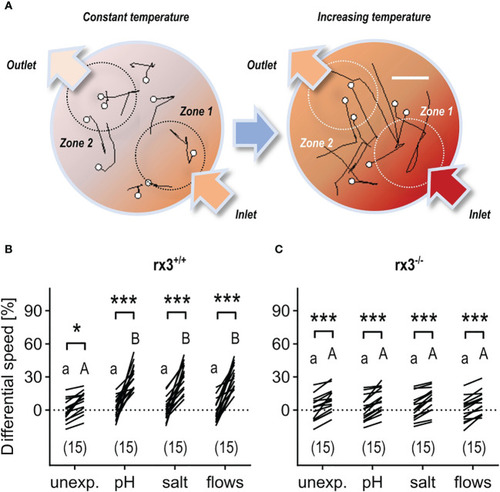
Response to rising temperature in rx3+/+ and rx3-/- zebrafish larvae under basal and stressed conditions. (A) Representative 1 s swim paths from larvae showing increased speed and turns near the inlet (bottom right arrow) as the temperature inside the swimming chamber increases faster in zone 1. White dots indicate start positions. Scale bar, 2.5 mm. Adapted from 43. (B, C) Differential speed, i.e., the difference between swim velocity (mm per 40 ms) in zones 1 and 2 (in %), across groups of unexposed (control) and pre-exposed (to either ‘pH’, ‘salt’ or ‘flows’) rx3+/+(B) and rx3-/-(C) larvae before and after the onset of temperature rise (see also Methods). Sample size in parentheses. (B, C) Letters and asterisks indicate results of Bonferroni’s tests (P<0.001) after two-way repeated measures ANOVAs; (B) time factor: F(1,56)=215.2, P<0.0001, treatment factor: F(3,56)=7.7, P=0.0002, time × treatment factor: F(3,56)=9.2, P<0.000; (C) time factor: F(1,56)=163.0, P<0.0001, treatment factor: F(3,56)=0.2, P=0.91, time × treatment factor: F(3,56)=0.3, P=0.83. |
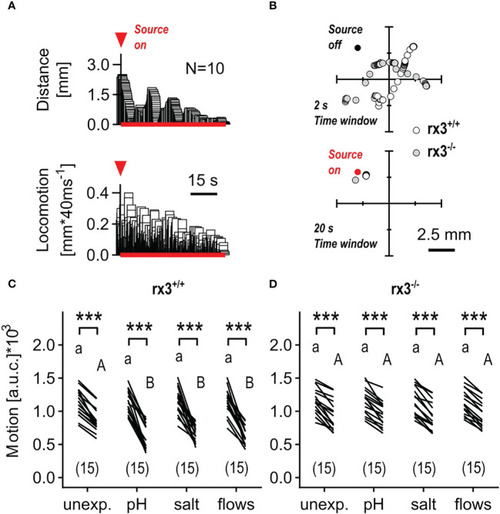
Response to minute water motions in rx3+/+ and rx3-/- zebrafish larvae under basal and stressed conditions. (A) Representative average trace of a wildtype larva’s distance to the stimulus source (top) and swimming activity (bottom) after the onset of mWMs. Red arrow heads in A depict the onset of stimulation. (See also Figure 3 in 50.) (B) Representative examples of consecutive x-y coordinates (swim trajectories) measured every 40 msec from rx3+/+ and rx3-/- larvae without (top) and with (bottom) mWMs. Top, 50 x-y coordinates per larva without mWMs (source off) measured over the last 2 s before the onset of mWMs. Bottom, 500 x-y coordinates per larva with mWMs (source on) measured over the last 20 s before the offset of mWMs. The time window in bottom (20 s) is enlarged 10 times relative to top (2 s) with the sole purpose of highlighting the mWMs-derived lack of locomotion observed typically at the end of a 2 min stimulation period. (C, D) Motion level, i.e., the area under the swim velocity-time curve over 120 s, across groups of unexposed and pre-exposed (same groups as in Figure 3B, C) rx3+/+(C) and rx3-/-(D) larvae before and during mWMs (see also Methods). Sample size in parentheses. (C, D) Letters and asterisks indicate results of Bonferroni’s tests (P<0.001) after two-way repeated measures ANOVAs; (C) time factor: F(1,56)=359.3, P<0.0001, treatment factor: F(3,56)=1.6, P=0.20, time × treatment factor: F(3,56)=5.6, P=0.002; (D) time factor: F(1,56)=317.0, P<0.0001, treatment factor: F(3,56)=0.03, P=0.99, time × treatment factor: F(3,56)=0.14, P=0.94. |