
|
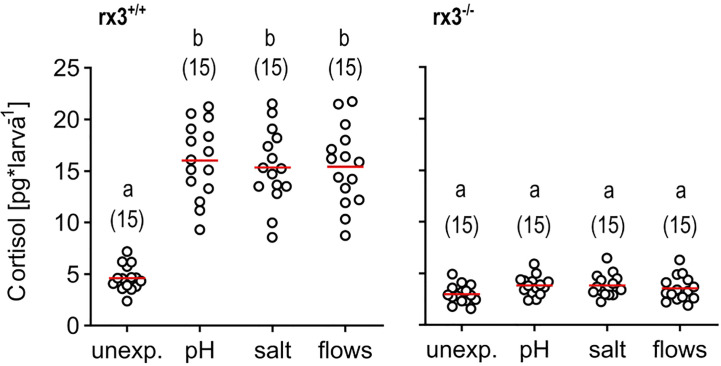
Figure 1
Glucocorticoid reactivity in rx3+/+ and rx3-/- zebrafish larvae. Whole-body cortisol in rx3+/+ (left) and rx3-/- (right) larvae (all data points shown, mean in red, sample size in parentheses) after exposure to a pH drop (pH), hyperosmotic medium (salt) or stress-evoking fast water flows (flows). Baseline levels are those of control (unexposed) larvae (unexp.), which were equally handled, omitting stressor exposure. Letters indicate results of Bonferroni’s tests (p < 0.001) after one-way ANOVAs (left, rx3+/+: F(3,59)=42.8, p < 0.0001, right, rx3-/-: F(3,59)=2.7, p = 0.1), followed by post hoc comparisons.