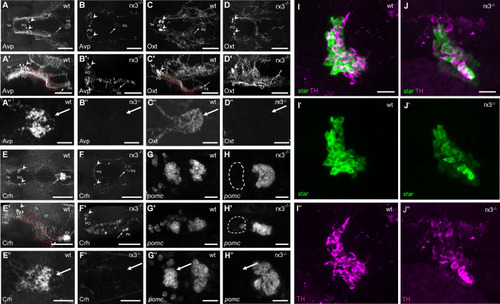
HPI axis elements in rx3+/+ and rx3-/- zebrafish larvae. A-F’’, The hypothalamic part of the HPI axis, illustrated by dorsal (A, B, C, D, E, F) and lateral (A’, B’, C’, D’, E’, F’) views of dorsally imaged IHC stainings of three NPO cell types. Cells producing Avp (A-A’), Oxt (C-C’), or Crh (E-E’) form a cluster in the NPO (arrowheads), and many of their fibers innervate the pituitary (arrows) in rx3+/+ wild-types (wt) via the hypothalamo-hypophyseal tract (red dotted lines). See also dense innervation in dorsal pituitary closeup views of more examples (A’’, C’’, E’’). In rx3-/- mutant larvae, cells producing Avp (B-B’), Oxt (D-D’), or Crh (F-F’) cluster less densely in the NPO (arrowheads) and their numbers are reduced. Pituitary innervation is present in some of the stainings (e.g., arrows in B, B’, F, F’) but not in others (e.g., D, D’); generally, the projection patterns appear drastically different. See also complete lack of innervation in dorsal pituitary closeup views of more examples (B’’, D’’, F’’). G-H, The pituitary part of the HPI axis, illustrated by dorsal (G, H) and lateral (G’, H’) images of ISH stainings for pomc. Two pituitary clusters are formed by pomc-positive cells in rx3+/+ wild-types (G-G’). The rostral cluster is absent, and the caudal cluster appears larger in rx3-/- mutants (H-H’). Another example is shown for each case as well (G’’, H’’). I-J’, The interrenal part of the HPI axis, illustrated by combined staining for star (I’, J’, ISH, steroidogenic part) and TH (I’’, J’’, IHC, chromaffin part). The interrenal gland is intact and both cell types are present in rx3+/+ wild-types (I-I’’) and rx3-/- mutants (J-J’’). Abbreviations: Avp, arginine vasopressin; Crh, corticotropic hormone; Oxt, oxytocin; PO, preoptic area; pomc, proopiomelanocortin; Pit, pituitary; PT, posterior tuberculum; Tel, telencephalon; Th, thalamus. Rostral to the left. Scale bars: 100 µm (A-D’, E-F’), 25 µm (A’’-D’’, E’’, F’’, G-H’’, I, J).
|
