
- Title
-
Manganese Exposure Induces Cellular Aggregates and the Accumulation of β-Catenin in Skin of Zebrafish Embryos
- Authors
- Gomes, G., Oliveira, J.L., Costa, M.L., Mermelstein, C., Feitosa, N.M.
- Source
- Full text @ Zebrafish
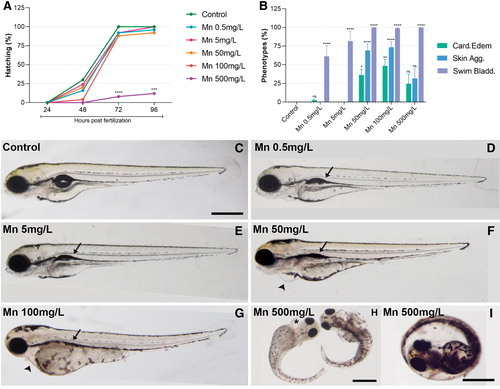
Mn treatment affects hatching and induces heart, swim bladder, and skin alterations. Zebrafish eggs were treated with Mn at 0.5, 5, 50, 100, and 500 mg/L and analyzed under a light microscope. Only 500 mg/L of Mn showed a significant inhibition of hatching (A, I). The zebrafish larvae also showed alteration in the swim bladder after treatment with all Mn concentrations tested (B, D–G), whereas cardiac edema and skin aggregates were found only after treatment with Mn levels higher than 50 mg/L (C, F–H). The results are expressed as mean ± SEM. The groups were performed with n = 5, where ****p < 0.0001, ***p < 0.001, **p < 0.01, *p < 0.05 versus control group. ns = nonsignificant. Statistical analysis was performed using one-way ANOVA followed by Tukey's post-test. Scale bar in C, H, and I = 500 μm. Arrowhead = cardiac edema; arrow = swim bladder; * = blood. ANOVA, analysis of variance; Mn, manganese; SEM, standard error of the mean. Color images are available online. |
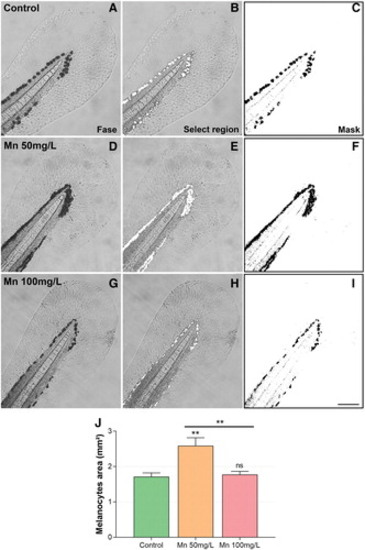
Mn treatment increases the area of melanocytes at the zebrafish fin. Zebrafish larvae were treated with Mn at 50 or 100 mg/L (A–I) and analyzed under a light microscope. Mn treatment with 50 mg/L induces an increase in the area of melanocytes (J), but not with 100 mg/L (J). Scale bar in I = 100 μm. The results are expressed as mean ± SEM. The groups were performed with n = 5, where **p < 0.01 versus control group. ns = nonsignificant. Statistical analysis was performed using one-way ANOVA followed by Tukey's post-test. Color images are available online. |
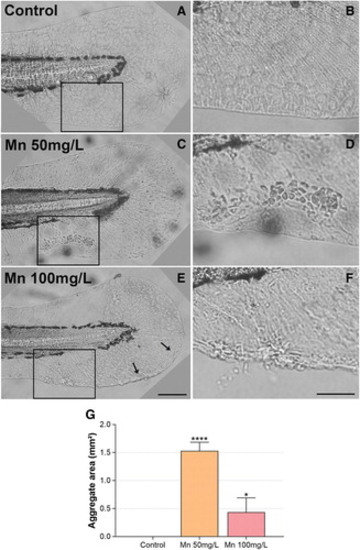
Mn treatment induces the formation of cellular aggregates at the zebrafish fin. Zebrafish larvae were treated with Mn at 50 or 100 mg/L (A–F) and analyzed under a light microscope. Quantification of the area of cellular aggregates found at zebrafish fin shows an increase after Mn treatment (G). Scale bars in E = 100 μm and F = 50 μm. The results are expressed as mean ± SEM. The groups were performed with n = 5, where ****p < 0.0001 and *p < 0.05 versus control group. Statistical analysis was performed using one-way ANOVA followed by Dunn's post-test. Color images are available online. |
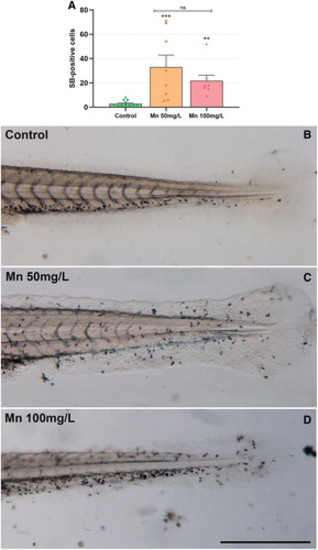
Mn treatment increases the number of SB-positive cells at the zebrafish fin. Zebrafish larvae were treated with Mn at 50 or 100 mg/L, stained with SB and analyzed under a light microscope (A–D). Scale bar in D = 500 μm. The groups were performed with n = 5, where ***p < 0.001, **p < 0.01 versus control group. ns, nonsignificant; SB, Sudan Black. Color images are available online. |
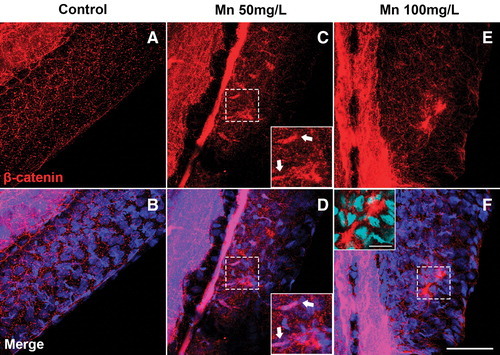
Mn treatment disorganizes the epithelium and induces the expression of β-Catenin in the caudal fin. Confocal analysis of zebrafish larvae at 96 h postfertilization stained with β-Catenin (red) and DAPI (blue). In the control embryo, β-Catenin is diffused at typical intercellular adherens junctions of epithelial cells (A, B). In the 50 mg/L Mn-treated embryo (C, D), β-Catenin-positive intercellular junctions appear disorganized and into the nuclei of some mesenchymal cells. In embryos treated with 100 mg/L Mn (E, F), β-Catenin is concentrated in some areas of the epithelial tissue. Scale bar in F = 50 μm and in the inset = 25 μm. The groups were performed with n = 5. DAPI, 4,6-diamidino-2-phenylindole dihydrochloride. Color images are available online. |