
Image
|
Figure Caption
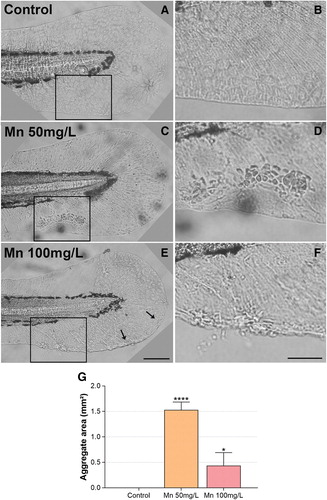
Fig. 3 Mn treatment induces the formation of cellular aggregates at the zebrafish fin. Zebrafish larvae were treated with Mn at 50 or 100 mg/L (A–F) and analyzed under a light microscope. Quantification of the area of cellular aggregates found at zebrafish fin shows an increase after Mn treatment (G). Scale bars in E = 100 μm and F = 50 μm. The results are expressed as mean ± SEM. The groups were performed with n = 5, where ****p < 0.0001 and *p < 0.05 versus control group. Statistical analysis was performed using one-way ANOVA followed by Dunn's post-test. Color images are available online.
Acknowledgments
This image is the copyrighted work of the attributed author or publisher, and
ZFIN has permission only to display this image to its users.
Additional permissions should be obtained from the applicable author or publisher of the image.
Full text @ Zebrafish