FIGURE SUMMARY
Title

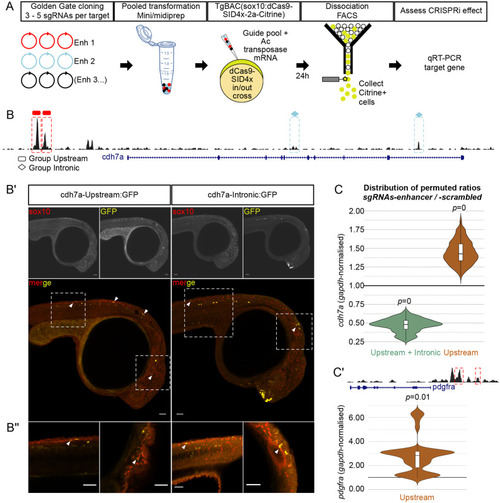
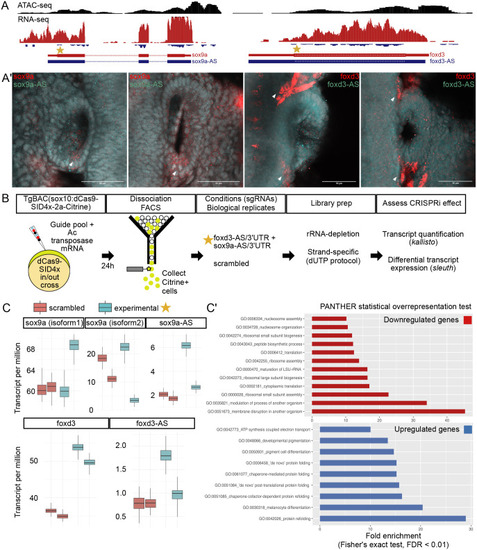
Ac/Ds transposition for CRISPR/dCas9-SID4x epigenome modulation in zebrafish

Authors
Chong-Morrison, V., Mayes, S., Simões, F.C., Senanayake, U., Carroll, D.S., Riley, P.R., Wilson, S.W., Sauka-Spengler, T.
Source
Full text @ Biol. Open

Evaluation of Ac/Ds and Tol2 transposition in F0 embryos. (A) Schematic of enhancer construct containing enhancers (‘enhancer’) upstream of E1b minimal promoter (‘E1b-mp’) driving eGFP expression. Two versions of each enhancer construct (with Ds- or Tol2-integration arms) were tested by microinjection into one-cell-stage embryos. Ac or Tol2 clutches of the same enhancer were imaged using the same settings on a fluorescent stereomicroscope. Embryos with the same expression pattern (Table S1) were counted. Scale bars: 500 µm. (B) Ds- or Tol2-armed pax3a enh5 was microinjected with Ac or Tol2 mRNA, respectively, into Gt(FoxD3:mCherry)ct110aR embryos to visualise the neural tube (mCherry, cyan). Live confocal imaging highlighted similar levels of neural crest cell labelling (eGFP, yellow) between 30 pg Ds and 150 pg Tol2 vector DNA, but 30 pg Tol2 vector DNA yielded a visually weaker signal. Scale bars: 50 µm.

Components of a CRISPRi genetic toolkit in zebrafish. (A) Schematic of Ac/Ds construct containing a guide RNA region (‘spacer’ and ‘tracrRNA’) cloned downstream of the zebrafish U6a promoter (‘DrU6a promoter’) followed by a U6 polymerase termination sequence (‘U6 stop’). The ‘spacer’ region is flanked with BsmBI restriction sites for Golden-Gate-like cloning of target spacers-of-choice. To evaluate expression of a scrambled guide RNA, RT-PCR primers and conditions were optimised to produce an 86 bp amplicon spanning the spacer and tracrRNA. (A′) RNA was collected from embryos injected with either the U6 vector scrambled sgRNA (filled circle) or in vitro-transcribed sgRNAs (empty circle) at 5 h, 24 h and 5 days post-injection. Only the RT-PCR product from U6-sgRNA injections could be detected at 5 days. (B) Schematic of BAC recombination to generate a Sox10-specific CRISPRi transgenic line, TgBAC(sox10:dCas9-SID4x-2a-Citrine)ox117. A recombination cassette contains nuclease-deficient Cas9 (‘NLS-dCas9-NLS’) fused to the SID4x repressor domain (‘SID4x’) followed by a ribosome-skipping Tav-2a peptide (‘T2A’) and Citrine fluorescent protein (‘Citrine’). Homology arms (red lines) enabled replacement of sox10’s first exon in BAC clone DKEY-201F15 with the dCas9-SID4x cassette. Transgenic offspring displayed largely overlapping expression with a different allele made from the same BAC (TgBAC(sox10:cytoBirA-2a-mCherry), ‘ox104’) in cranial and trunk neural crest cells, as well as the otic vesicle (ov) (B′,B″). However, unlike the ox104 line, Citrine is not expressed in ox117’s neural tube (B‴). Scale bars: 50 µm.

CRISPRi of neural crest enhancers. (A) Sox10:CRISPRi workflow to investigate function of enhancers in microinjected zebrafish embryos. 3-5 spacer sequences per enhancer for 2-4 enhancers per target gene were selected and individually cloned into Ac/Ds U6 vector. Cloned guides were combined according to experimental design and transformed to obtain a single prep per pool with sufficient quality and concentration. Scrambled guide pools were prepared in parallel as control. Guide pools (enhancer or scrambled) were microinjected into one-cell-stage ox117 embryos and allowed to develop for 24 h. Embryos were dissociated and FAC-sorted to collect sox10:Citrine+ cells expressing dCas9-SID4x. RNA was extracted and expression of endogenous target controlled by the enhancers tested was measured by quantitative PCR. (B) UCSC Genome Browser snapshot of the cdh7a locus showing ATAC-seq from sox10+ cells (black track). Four cdh7a putative enhancer regions were investigated: two upstream (rectangles) and two within introns (diamonds). (B′) Combined readout of ‘upstream’ or ‘intronic’ cdh7a enhancer activity in F0 embryos. Each enhancer was cloned into Ac/Ds enhancer:GFP construct (Fig. 1). ‘Upstream’ or ‘intronic’ enhancers were pooled and pools microinjected into one-cell-stage embryos. Enhancer(s) activity (‘GFP’) in relation to endogenous sox10 (‘sox10’) expression was detected by immunohistochemistry at 24 hpf. (B″) Sporadic overlap (white arrows) of enhancer(s) activity were detected in the trunk neural crest in both cases, in the cranial mesenchyme only for ‘upstream’, and in the otic vesicle for ‘intronic’ enhancers. Maximum intensity Z-stack projections are shown in (B′), single plane confocal images are shown in (B″). Scale bars: 50 µm. (C) Quantitative PCR of cdh7a following CRISPRi of its putative enhancers (n=4 per condition). Downregulation of cdh7a (median±s.d.=0.481±0.089; P=0) was observed when all four enhancers were targeted, compared to scrambled control. This effect was reversed (median±s.d.=1.426±0.155; P=0) when the upstream enhancers only were targeted. (C′) A similar upregulation effect (median±s.d.=2.822±1.419; P=0.01) when upstream enhancers were targeted was observed at the pdgfra locus.

CRISPRi of antisense transcription initiation at neural crest genes. (A) UCSC Genome Browser snapshot of the sox9a and foxd3 loci with ATAC-seq (black track) and strand-specific RNA-seq (red track, sense; blue track, antisense) from sox10+ cells (ATAC-seq) or nuclei (RNA-seq). Selected guide RNAs target the initiation of antisense transcription (star) of sox9a-AS or foxd3-AS. (A′) Hybridisation Chain Reaction detection of coding/sense (sox9a, foxd3) and antisense (sox9a-AS, foxd3-AS) transcripts in 24 hpf embryos. Antisense transcripts/puncta (cyan) were expressed in a ubiquitous, basal-like fashion. A similar basal-like expression of sense transcripts/puncta (red channel) was observed, along with spatially restricted regions of higher expression (white arrows). Single plane confocal images of the otic vesicle region are shown. Scale bars: 50 µm. (B) Sox10:CRISPRi workflow to investigate effect of sense/antisense transcription in microinjected zebrafish embryos. Ac/Ds U6 cloned guides were pooled according to experimental design (10 guides in total, five per locus) and transformed into bacteria to obtain a single prep per pool of high quality. Guide pools (foxd3+sox9a; or scrambled) were microinjected into one-cell-stage ox117 embryos and allowed to develop for 24 h. Embryos were dissociated and FAC-sorted to collect sox10:Citrine+ cells expressing dCas9-SID4x. RNA was extracted and RNAseq libraries were prepared using rRNA-depletion followed by strand-specific dUTP method with two replicates per condition. Transcript quantification and differential expression were performed using the kallisto/sleuth statistical pipeline. (C) Quantification of transcripts (transcripts per million, TPM) following sox10:CRISPRi. Bootstrapped estimates of sense and antisense sox9a/foxd3 transcripts in each biological replicate. Down/upregulation could be detected for sense and antisense foxd3/sox9a transcripts in experimental versus scrambled condition although not statistically significant, with the exception of foxd3 (FC=1.261, qval=0.007). (C′) PANTHER Gene Ontology (GO) overrepresentation statistical analysis of differentially expressed genes (qval <0.05). Top 10 GO terms (Fisher's exact test, with false discovery rate <0.01) shown.

Acknowledgments
This image is the copyrighted work of the attributed author or publisher, and ZFIN has permission only to display this image to its users. Additional permissions should be obtained from the applicable author or publisher of the image. Full text @ Biol. Open