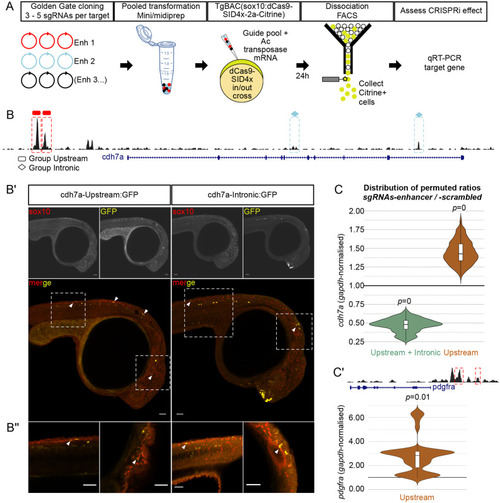
CRISPRi of neural crest enhancers. (A) Sox10:CRISPRi workflow to investigate function of enhancers in microinjected zebrafish embryos. 3-5 spacer sequences per enhancer for 2-4 enhancers per target gene were selected and individually cloned into Ac/Ds U6 vector. Cloned guides were combined according to experimental design and transformed to obtain a single prep per pool with sufficient quality and concentration. Scrambled guide pools were prepared in parallel as control. Guide pools (enhancer or scrambled) were microinjected into one-cell-stage ox117 embryos and allowed to develop for 24 h. Embryos were dissociated and FAC-sorted to collect sox10:Citrine+ cells expressing dCas9-SID4x. RNA was extracted and expression of endogenous target controlled by the enhancers tested was measured by quantitative PCR. (B) UCSC Genome Browser snapshot of the cdh7a locus showing ATAC-seq from sox10+ cells (black track). Four cdh7a putative enhancer regions were investigated: two upstream (rectangles) and two within introns (diamonds). (B′) Combined readout of ‘upstream’ or ‘intronic’ cdh7a enhancer activity in F0 embryos. Each enhancer was cloned into Ac/Ds enhancer:GFP construct (Fig. 1). ‘Upstream’ or ‘intronic’ enhancers were pooled and pools microinjected into one-cell-stage embryos. Enhancer(s) activity (‘GFP’) in relation to endogenous sox10 (‘sox10’) expression was detected by immunohistochemistry at 24 hpf. (B″) Sporadic overlap (white arrows) of enhancer(s) activity were detected in the trunk neural crest in both cases, in the cranial mesenchyme only for ‘upstream’, and in the otic vesicle for ‘intronic’ enhancers. Maximum intensity Z-stack projections are shown in (B′), single plane confocal images are shown in (B″). Scale bars: 50 µm. (C) Quantitative PCR of cdh7a following CRISPRi of its putative enhancers (n=4 per condition). Downregulation of cdh7a (median±s.d.=0.481±0.089; P=0) was observed when all four enhancers were targeted, compared to scrambled control. This effect was reversed (median±s.d.=1.426±0.155; P=0) when the upstream enhancers only were targeted. (C′) A similar upregulation effect (median±s.d.=2.822±1.419; P=0.01) when upstream enhancers were targeted was observed at the pdgfra locus.
|
