FIGURE SUMMARY
Title

IFT46 gene promoter-driven ciliopathy disease model in zebrafish

Authors
Lee, M.S., Han, H.J., Choi, T.I., Lee, K.H., Baasankhuu, A., Kim, H.T., Kim, C.H.
Source
Full text @ Front Cell Dev Biol

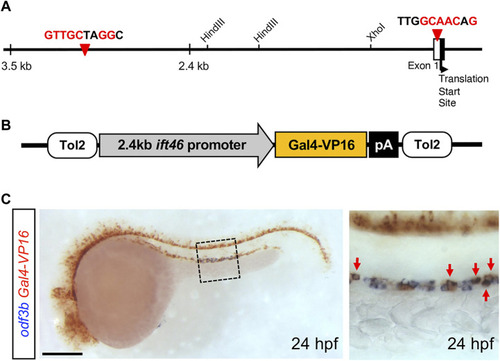
Transient expression of IFT46:GAL4-VP16 in ciliated cells. (A) Schematic representation of the 5′ upstream regulatory region of the IFT46 gene that contains putative two RFX2 transcription factor-binding site sequences (red arrowheads). (B) Schematic view of the Tol2-based construct containing GAL4-VP16 under the control of the 2.4 kb IFT46 promoter. (C) Two-color in situ hybridization of the GAL4-VP16 chimeric transcription factor (red) with odf3b (blue) at 24 hpf. GAL4-VP16 transcripts are expressed in multi-ciliated cells (box region) in the distal segment of the pronephric duct (red arrows). Scale bar: 200 μm (C).

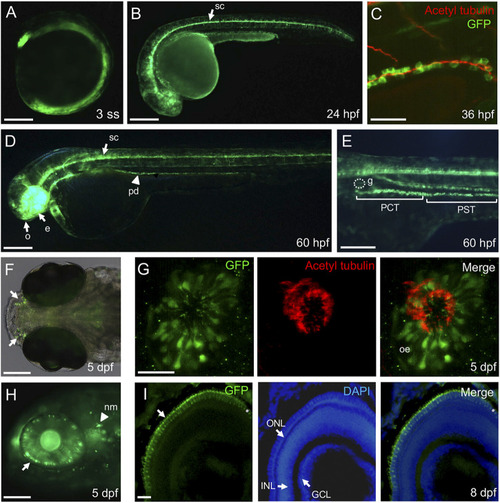
Ciliated cell-specific expression in the stable transgenic IFT46:GAL4-VP16;UAS:mGFP line. (A) Ubiquitous expression of the GFP reporter at three somite-stage embryos. (B) The GFP is strongly expressed in the spinal canal (arrow) at 24 hpf. (C) Immunostaining of anti-acetylated α-tubulin (marking cilia) with GFP in the posterior region of the pronephric duct at 36 hpf. The acetylated α-tubulin signals are overlapped on the apical region of GFP-expressing cells. (D) At 60 hpf, the GFP reporter is expressed in the olfactory region (o), eye (e), spinal canal (arrow), and pronephric duct (arrowhead). (E) High magnification image of the trunk region at 60 hpf. The GFP expression is detected in the proximal convoluted tubule (PCT) and proximal straight tubule (PST) but not in glomerulus (g). (F) Dorsal view of the olfactory region (arrow) in the transgenic IFT46:GAL4-VP16;UAS:GFP line at 5 dpf. (G) Immunostaining of anti-acetylated α-tubulin (marking cilia) with GFP in the olfactory region of the transgenic fish. The olfactory cilia stained with acetylated α-tubulin and GFP reporter detected in the olfactory epithelium (Oe) at 5 dpf. (H) The GFP expression is restricted in the outer nuclear layer of the retina and neuromast cells (nm, arrowhead) at 5 dpf. (I) Transverse section images of the retina at 8 dpf. The GFP reporter is expressed in photoreceptor cells in the outer nuclear layer (ONL) of the retina. Nuclei are counterstained with DAPI. INL, inner nuclear layer; GCL, ganglion cell layer. Scale bars: 200 μm (A,B,D), 100 μm (E,F,H), 50 μm (C), and 25 μm (G,I).

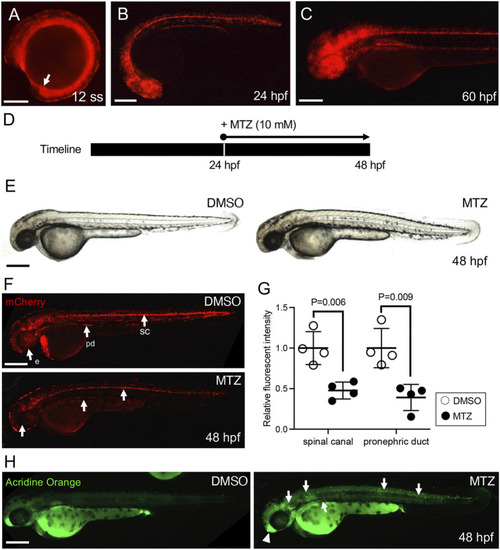
Establishment of the ciliated cell-specific ablation zebrafish model. (A) The mCherry reporter expression in a stable transgenic IFT46:GAL4-VP16;UAS:nsfb-mCherry line at the 12 somite stage. The arrow indicates Kupffer’s vesicle. (B,C) mCherry is expressed in ciliated organs including the eye, olfactory region, spinal canal, and pronephric duct at 24 hpf (B) and 60 hpf (C). Scale bar = 200 μm. (D) Schematic timeline of MTZ treatment in transgenic embryos. (E) Gross morphology of MTZ-treated 48 hpf zebrafish embryos. (F) The mCherry expression in MTZ-treated 48 hpf larvae. The MTZ-treated embryos show decreased mCherry signals in the spinal canal, pronephric duct, and eye. (G) The fluorescence intensity of mCherry signals is significantly decreased in both the spinal cord and pronephric duct in MTZ-treated embryos. Error bars are the mean ± S.E.M; p-values are determined by the unpaired Mann–Whitney test (*p = 0.006 and *p = 0.009). (H) The MTZ-treated embryo showed increased acridine orange-positive cell death in the spinal canal, pronephric duct, and olfactory region in mCherry-expressing cells. Scale bars: 200 μm (A,B,C,E,F,H).

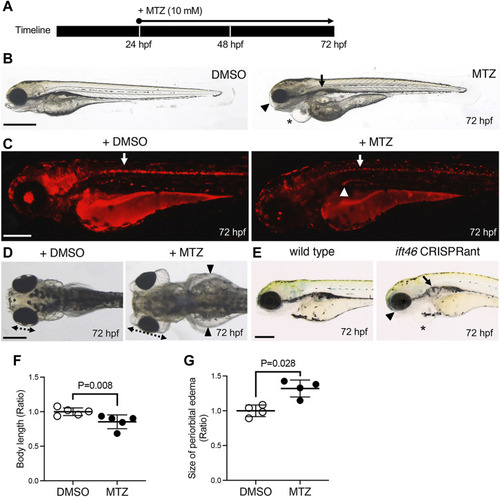
Ciliopathy zebrafish model by ciliated cell ablation in Tg(IFT46:GAL4-VP16;UAS:nsfb-mCherry). (A) Schematic timeline of MTZ treatment in transgenic embryos. (B) The MTZ-treated embryos exhibit shortened body length, eye edema (arrowhead), cardiac edema (asterisk), and cystic kidney (arrow) at 72 hpf. (C) mCherry signals are significantly decreased in the spinal canal (arrow) and pronephric duct (arrowhead) after MTZ-treated larvae compared to DMSO-treated larvae. (D) Gross morphology in the anterior region of DMSO and MTZ-treated larvae at 72 hpf. The MTZ-treated larvae show severe whole-body edema (arrowheads), cystic kidney (arrow), and periorbital edema. The dotted lines indicate the eye size. (E) Morphological phenotypes of IFT46 CRISPRant at 72 hpf. CRISPRant exhibits periorbital edema (arrowhead), cardiac edema (asterisk), and cystic kidney (arrow). (F,G) Quantification of whole-body length (based on the length of head to end of tail fin) (F) and periorbital edema size (G) in MTZ-treated larvae compared to DMSO-treated larvae at 72 hpf. Error bars are the mean ± S.E.M; p-values are determined by the unpaired Mann–Whitney U-test (*p = 0.008 and *p = 0.028). Scale bars: 500 μm (B) and 250 μm (C–E).

Acknowledgments
This image is the copyrighted work of the attributed author or publisher, and ZFIN has permission only to display this image to its users. Additional permissions should be obtained from the applicable author or publisher of the image. Full text @ Front Cell Dev Biol