IMAGE

FIGURE 3

ID
ZDB-IMAGE-230629-90
Source
Figures for Lee et al., 2023
Image
Figure Caption

FIGURE 3

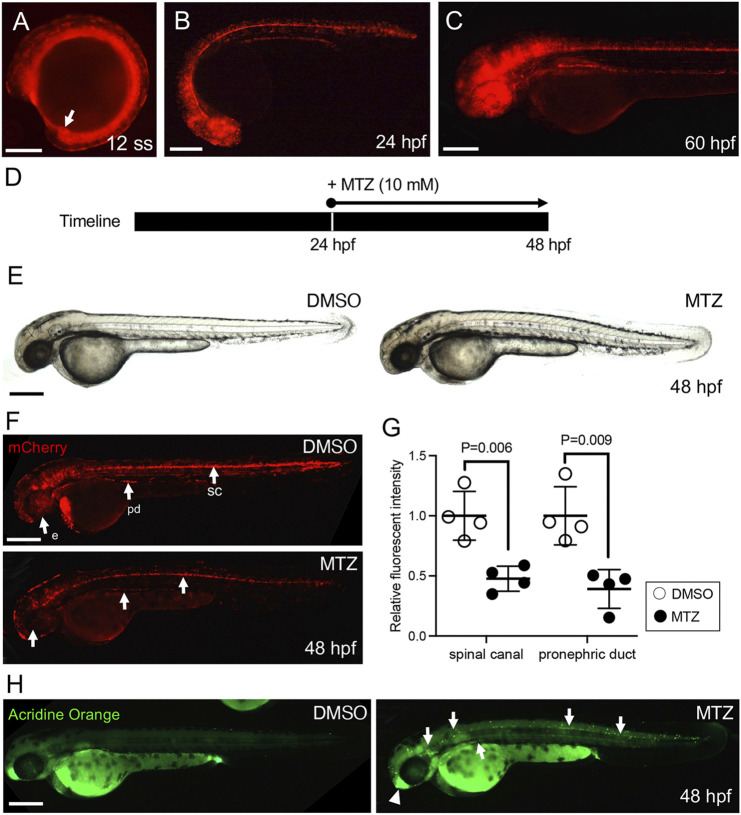
Establishment of the ciliated cell-specific ablation zebrafish model. (A) The mCherry reporter expression in a stable transgenic IFT46:GAL4-VP16;UAS:nsfb-mCherry line at the 12 somite stage. The arrow indicates Kupffer’s vesicle. (B,C) mCherry is expressed in ciliated organs including the eye, olfactory region, spinal canal, and pronephric duct at 24 hpf (B) and 60 hpf (C). Scale bar = 200 μm. (D) Schematic timeline of MTZ treatment in transgenic embryos. (E) Gross morphology of MTZ-treated 48 hpf zebrafish embryos. (F) The mCherry expression in MTZ-treated 48 hpf larvae. The MTZ-treated embryos show decreased mCherry signals in the spinal canal, pronephric duct, and eye. (G) The fluorescence intensity of mCherry signals is significantly decreased in both the spinal cord and pronephric duct in MTZ-treated embryos. Error bars are the mean ± S.E.M; p-values are determined by the unpaired Mann–Whitney test (*p = 0.006 and *p = 0.009). (H) The MTZ-treated embryo showed increased acridine orange-positive cell death in the spinal canal, pronephric duct, and olfactory region in mCherry-expressing cells. Scale bars: 200 μm (A,B,C,E,F,H).

Acknowledgments
This image is the copyrighted work of the attributed author or publisher, and ZFIN has permission only to display this image to its users. Additional permissions should be obtained from the applicable author or publisher of the image. Full text @ Front Cell Dev Biol