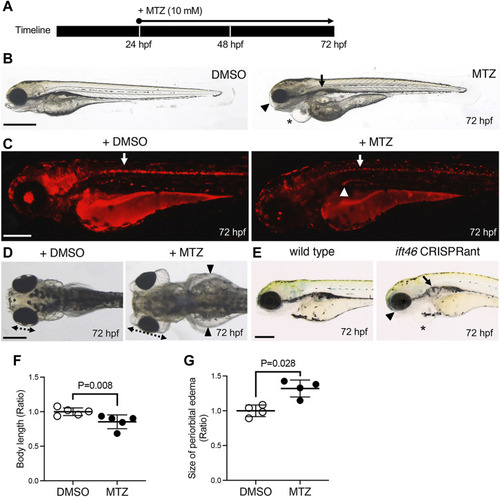
Ciliopathy zebrafish model by ciliated cell ablation in Tg(IFT46:GAL4-VP16;UAS:nsfb-mCherry). (A) Schematic timeline of MTZ treatment in transgenic embryos. (B) The MTZ-treated embryos exhibit shortened body length, eye edema (arrowhead), cardiac edema (asterisk), and cystic kidney (arrow) at 72 hpf. (C) mCherry signals are significantly decreased in the spinal canal (arrow) and pronephric duct (arrowhead) after MTZ-treated larvae compared to DMSO-treated larvae. (D) Gross morphology in the anterior region of DMSO and MTZ-treated larvae at 72 hpf. The MTZ-treated larvae show severe whole-body edema (arrowheads), cystic kidney (arrow), and periorbital edema. The dotted lines indicate the eye size. (E) Morphological phenotypes of IFT46 CRISPRant at 72 hpf. CRISPRant exhibits periorbital edema (arrowhead), cardiac edema (asterisk), and cystic kidney (arrow). (F,G) Quantification of whole-body length (based on the length of head to end of tail fin) (F) and periorbital edema size (G) in MTZ-treated larvae compared to DMSO-treated larvae at 72 hpf. Error bars are the mean ± S.E.M; p-values are determined by the unpaired Mann–Whitney U-test (*p = 0.008 and *p = 0.028). Scale bars: 500 μm (B) and 250 μm (C–E).
|
