
- Title
-
Retinal degeneration in rpgra mutant zebrafish
- Authors
- Liu, X., Han, S., Liu, F., Yu, S., Qin, Y., Li, J., Jia, D., Gao, P., Chen, X., Tang, Z., Liu, M., Huang, Y.
- Source
- Full text @ Front Cell Dev Biol
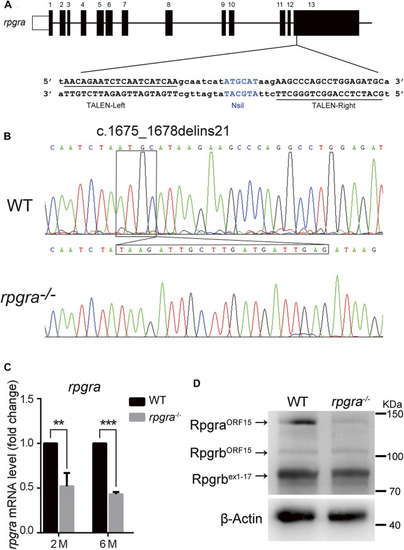
Generation of the |
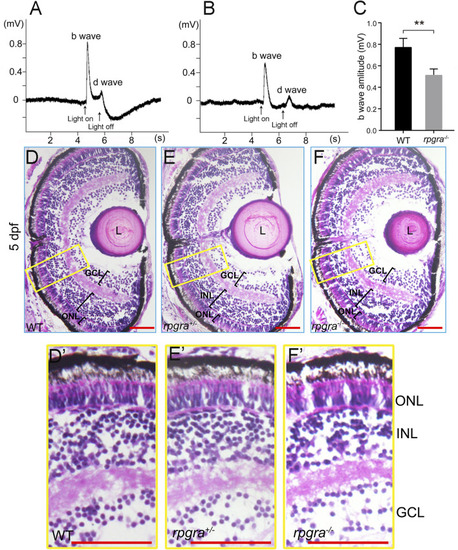
Visual impairment in the |
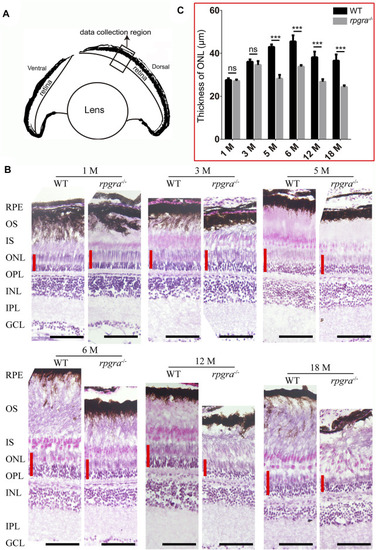
Retinal degeneration in |
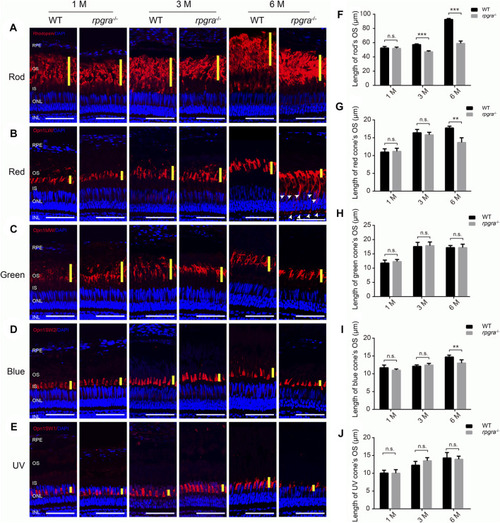
Photoreceptor outer segment is affected in |
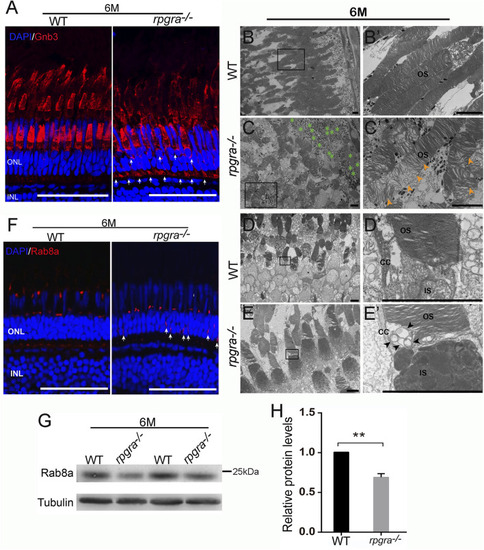
Abnormal ciliary trafficking in |