FIGURE SUMMARY
Title

NERNST: a genetically-encoded ratiometric non-destructive sensing tool to estimate NADP(H) redox status in bacterial, plant and animal systems

Authors
Molinari, P.E., Krapp, A.R., Weiner, A., Beyer, H.M., Kondadi, A.K., Blomeier, T., López, M., Bustos-Sanmamed, P., Tevere, E., Weber, W., Reichert, A.S., Calcaterra, N.B., Beller, M., Carrillo, N., Zurbriggen, M.D.
Source
Full text @ Nat. Commun.

Design, construction and in vitro characterization of NERNST.

a Proposed mechanism of NERNST interaction and electron exchange with NADP(H). Molecular organization of the input (NTRC with NTR and Trx domains) and output (roGFP2) modules of the biosensor, separated by the spacer arm (top, left), and the intra-complex flow of electrons from NADPH to the vicinal dithiols of a second NERNST subunit, as proposed in ref. 27 (top, right). Numbering of active site cysteines corresponds to that of NTRC27. Changes resulting from the NADPH-dependent turnover of NERNST and emission spectra of the fully oxidized (above) and reduced (below) biosensor are shown for comparison (bottom). The color bar reflects the oxidation state (R values) in pseudocolors. This applies to all figures. b Redox state, as estimated by the R values, of NERNST equilibrated with various oxidants and reductants in 100 mM K3PO4 pH 7, 150 mM NaCl. DTT and H2O2 were used at 10 mM; NADPH, NADH and GSH at 0.5 mM. c The Cys-to-Ser mutant of NERNST (Mut) is not reduced by NADPH. Conditions were those of panel (b). Wt, wild-type biosensor. d Reduction of NERNST by different concentrations of NADPH. e Plot of OxDNERNST (as determined from the R values) against the redox potential ENADP(H) (E). The biosensor was equilibrated with different NADPH/NADP+ ratios at 0.5 mM or 1 mM total NADP(H) concentration. The upper abscissa represents the ratio of NADPH/NADP+. f Effect of pH on the ratiometric behavior of purified NERNST. The biosensor was incubated with 10 mM DTT, 10 mM H2O2 or an equimolar NADPH/NADP+ mixture of 1 mM NADP(H) in a buffer containing 0.2 M NaH2PO4 and 0.2 M Na2HPO4 adjusted to the indicated pH. SD values were within the size of the data points. Data shown in (bf) are means ± SD of 3 independent determinations. ****P ≤ 0.0001; ns, non-significant. b One-way ANOVA followed by Tukey’s multiple comparisons test, c Two-way ANOVA followed by Bonferroni’s multiple comparisons test. Source data, including exact P values, are provided as a Source Data file.

NADP(H) redox state in E. coli cells.

a Bacteria expressing NERNST were grown in Luria-Bertani (LB) broth or fed with acetate, glycerol or glucose in M9 minimal medium. Cells were collected at mid-exponential phase, except for LB stationary. Representative images show the ratios R of the intensities of fluorescence emission after excitation of the cell suspensions at 405 nm and 488 nm in pseudocolors. Scale bar = 5 μm. Pseudocolor scale = R values. Confocal images are ordered from the lower to the higher redox potentials. b Estimation of ENADP(H) (E) in the E. coli cytosol as determined by NERNST biosensor imaging (BS) and redox cycling (RC). Data shown are means ± SD of 2–6 independent determinations. ns, non-significant; two-way ANOVA followed by Bonferroni’s multiple comparisons test. ND, not determined. Source data, including all precise n values, are provided as a Source Data file.

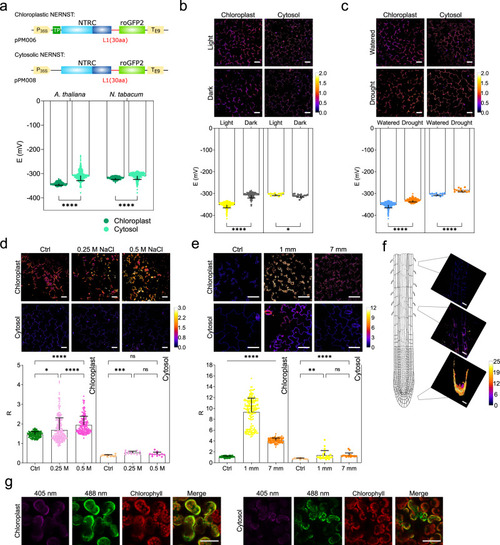
In vivo analysis of the NADP(H) redox state in the cytosol and chloroplasts of leaf cells and roots.

a Top, constructs for stable NERNST expression in the cytosol or chloroplasts of plants under control of the P35S promoter. TP: plastid-targeting sequence; L1: 30-aa linker. Bottom, estimation of ENADP(H) in the chloroplasts and cytosol of illuminated Arabidopsis and N. tabacum leaf cells. Potentials were calculated assuming pH of 7.3 and 8.0 for cytosol and stroma, respectively60. Data shown are means ± SD of 131–253 cells. ****P ≤ 0.0001; two-way ANOVA, Bonferroni’s multiple comparisons test. b Light response of NERNST in tobacco leaf cells illuminated (Light) or not (Dark) at 200 μmol quanta m−2 s−1 for 3 h. ENADP(H) values were calculated assuming stromal pH of 7.2 and 8.0 for dark and light conditions, respectively61,62. Data shown are means ± SD of 12-363 cells. *P ≤ 0.05, ****P ≤ 0.0001; two-tailed Mann–Whitney test (Chloroplast) or Unpaired t test (Cytosol). c Drought responses of NERNST in tobacco leaf cells. Excised leaves were air-dried for 3 h, prior to NERNST imaging. Data shown are means ± SD of 12-356 cells. ****P ≤ 0.0001; two-tailed Mann–Whitney test (Chloroplast) or Unpaired t test (Cytosol). d Salt responses of NERNST-expressing tobacco leaf discs exposed to the indicated concentrations of NaCl for 16 h. Data shown are means ± SD of 12-229 cells. *P ≤ 0.05, ***P ≤ 0.001, ****P ≤ 0.0001; ns, non-significant; one-way ANOVA, Dunn’s multiple comparisons test (Chloroplast) or Bonferroni’s multiple comparisons test (Cytosol). e NERNST imaging of tobacco leaves inoculated with P. carotovorum at two distances from the infiltration site. Data shown are means ± SD of 10-175 cells. **P ≤ 0.01, ****P ≤ 0.0001; ns, non-significant; one-way ANOVA, Dunn’s multiple comparisons test. f Ratiometric images (R values) of roots from 14-day-old tobacco plants grown in 0.5×MS-agar. g Transiently-expressed NERNST in the chloroplasts and cytosol of N. benthamiana leaf cells. Right panels: merge between 488-nm and chlorophyll fluorescence. Representative images and data shown were produced in at least two independent experiments. Scale bars, 50 μm. bf Pseudocolor scales = R values. Source data, including all precise n values and exact P values, are provided as a Source Data file.

NERNST probes the NADP(H) redox status in isolated leaf protoplasts.

Expression vectors used are those described in Fig. 3a. a Representative fluorescence images of NERNST in protoplasts isolated from Arabidopsis and tobacco leaves expressing the biosensor in chloroplasts (Chlo) or the cytosol (Cyt). Panels show merge between 488-nm and chlorophyll fluorescence, and R imaging. Scale bars, 20 μm. Pseudocolor scale = R values. b NADP(H) redox potentials (E) were estimated assuming pH values of 7.3 and 8.0 for the cytosol and stroma, respectively60. ****P ≤ 0.0001; two-way ANOVA followed by Bonferroni’s multiple comparisons test. c, d Comparison of cytosolic ENADP(H) (c) and dynamic ranges including controls (d) between isolated Arabidopsis protoplasts stably and transiently expressing NERNST. ns, non-significant. Data are shown as means ± SD of 22-50 cells (b), 13–28 cells (c), 10-28 cells (d). Data were analyzed by two-way ANOVA followed by Bonferroni’s multiple comparisons test (b, d), two-tailed Unpaired t test (c). Source data, including all precise n values and exact P values, are provided as a Source Data file.

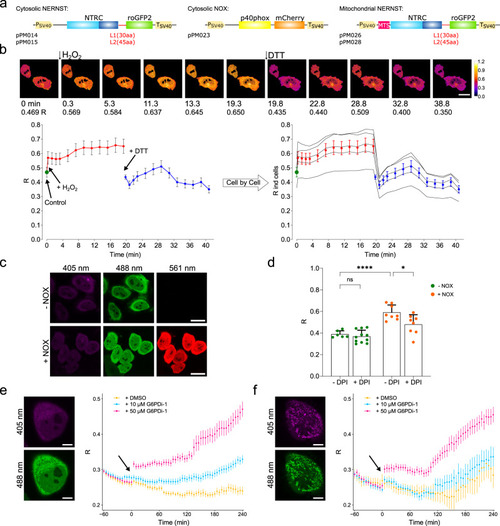
Mid-throughput analysis of NADP(H) dynamics in mammalian cells and mitochondria.

a Construct design for expression of NERNST and the p40phox subunit of NADPH oxidase fused to the fluorescent marker mCherry (NOX) in the cytosol and mitochondria of mammalian cells. NERNST was placed under control of the SV40 promoter in pPM014/15, and the mitochondrial targeting sequence (MTS) for mitochondrial localization in pPM026/28. L1: 30-aa linker. L2: 45-aa linker. b Spatio-temporal resolution of fluorescence R responses of the NERNST biosensor expressed in HeLa cells to successive additions of 10 mM H2O2 and 10 mM DTT, as shown in sequential frames (above), time-course and R values (below). Scale bars, 20 μm. Average (left) and cell-by-cell (right) analyses are shown in the lower part of the panel. Time 0 (green dots) indicates cells without treatments. Data shown are means ± SEM of 5 cells. Pseudocolor scale = R values. c Representative fluorescence images of NERNST (405 nm and 488 nm) co-expressed (bottom) or not (top) with NOX (561 nm). Scale bars, 20 μm. d NOX-mediated oxidation of the NADP(H) pool was abolished by the addition of 50 μM DPI. Data shown are means ± SD of 6-11 cells. *P ≤ 0.05, ****P ≤ 0.0001, ns, non-significant; two-way ANOVA followed by Tukey’s multiple comparisons test. e, f Kinetics of NERNST fluorescence responses in the cytosol (e) or mitochondria (f) of HeLa cells upon the addition of dimethyl sulfoxide (DMSO; control), 10 μM or 50 μM of the G6PDH inhibitor G6PDi-1, as determined with the PerkinElmer Operetta multi-well plate format confocal microscope. Data shown are means ± SEM of 7-98 cells. Representative images of cells expressing NERNST in cytosol (e) and mitochondria (f) are shown on the left. Scale bars, 10 μm. Source data, including all precise n values and exact P values, are provided as a Source Data file.

Simultaneous imaging of NADP(H) and peroxide dynamics in a wounded region of zebrafish tail fin

a Experimental set-up to evaluate NADP(H) redox status and ROS levels in zebrafish embryos after wounding. The upper part shows the constructs used for NERNST and HyPerRed expression, cloned into the pCS2+MT vector system between the SP6 promoter and SV40 terminator and in vitro transcribed from the corresponding linearized plasmids (pAK001/2). The mixed mRNAs were microinjected in 1-cell zebrafish embryos (scheme created with BioRender.com). b Visualization of NERNST (left) and HyPerRed (right) fluorescence in zebrafish specimens was carried out in each of 3 independent experiments at 48 h post-fertilization using an Olympus MVX10 Macro Zoom fluorescence microscope. Emission of NERNST was monitored at 510 nm after excitation at 488 nm, whereas the HyperRed sensor was excited at 543 nm and recorded at 610 nm. Representative images are shown. Scale bars, 50 μm. c Time-resolved NADP(H) and peroxide dynamics in wounded margins of the tail fin tip. From left to right, R (NERNST), brightfield and Fluorescence Intensity (FI; HyPerRed). Times after wounding are shown in the R panels. Scale bar, 50 μm. Pseudocolor scale = R values. Red scale = HyPerRed Fluorescence Intensity. (d) Kinetics of NADP(H) and peroxide changes. Green line, R values of NERNST; red line, HyPerRed fluorescence. Data in (d) are means ± SD of 2 (NERNST) or 3 (HyPerRed) independent measurements. Source data are provided as a Source Data file.

Acknowledgments
This image is the copyrighted work of the attributed author or publisher, and ZFIN has permission only to display this image to its users. Additional permissions should be obtained from the applicable author or publisher of the image. Full text @ Nat. Commun.