IMAGE

Fig. 6

ID
ZDB-IMAGE-230609-28
Source
Figures for Molinari et al., 2023
Image
Figure Caption

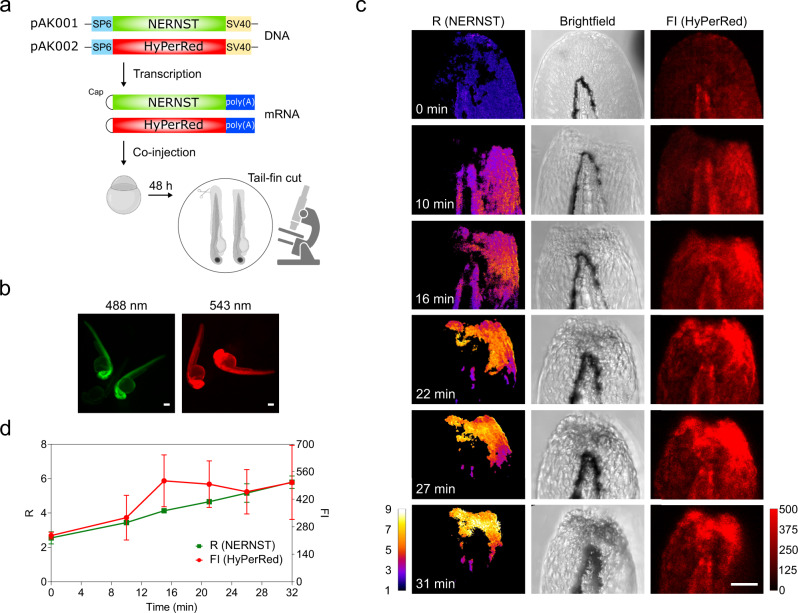
Fig. 6 Simultaneous imaging of NADP(H) and peroxide dynamics in a wounded region of zebrafish tail fin

a Experimental set-up to evaluate NADP(H) redox status and ROS levels in zebrafish embryos after wounding. The upper part shows the constructs used for NERNST and HyPerRed expression, cloned into the pCS2+MT vector system between the SP6 promoter and SV40 terminator and in vitro transcribed from the corresponding linearized plasmids (pAK001/2). The mixed mRNAs were microinjected in 1-cell zebrafish embryos (scheme created with BioRender.com). b Visualization of NERNST (left) and HyPerRed (right) fluorescence in zebrafish specimens was carried out in each of 3 independent experiments at 48 h post-fertilization using an Olympus MVX10 Macro Zoom fluorescence microscope. Emission of NERNST was monitored at 510 nm after excitation at 488 nm, whereas the HyperRed sensor was excited at 543 nm and recorded at 610 nm. Representative images are shown. Scale bars, 50 μm. c Time-resolved NADP(H) and peroxide dynamics in wounded margins of the tail fin tip. From left to right, R (NERNST), brightfield and Fluorescence Intensity (FI; HyPerRed). Times after wounding are shown in the R panels. Scale bar, 50 μm. Pseudocolor scale = R values. Red scale = HyPerRed Fluorescence Intensity. (d) Kinetics of NADP(H) and peroxide changes. Green line, R values of NERNST; red line, HyPerRed fluorescence. Data in (d) are means ± SD of 2 (NERNST) or 3 (HyPerRed) independent measurements. Source data are provided as a Source Data file.

Acknowledgments
This image is the copyrighted work of the attributed author or publisher, and ZFIN has permission only to display this image to its users. Additional permissions should be obtained from the applicable author or publisher of the image. Full text @ Nat. Commun.