|
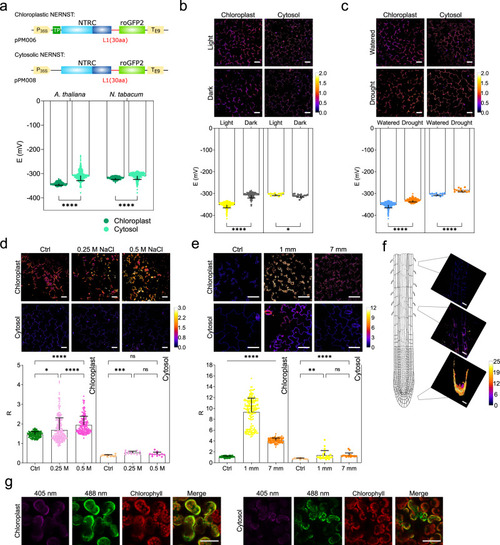
In vivo analysis of the NADP(H) redox state in the cytosol and chloroplasts of leaf cells and roots. a Top, constructs for stable NERNST expression in the cytosol or chloroplasts of plants under control of the P35S promoter. TP: plastid-targeting sequence; L1: 30-aa linker. Bottom, estimation of ENADP(H) in the chloroplasts and cytosol of illuminated Arabidopsis and N. tabacum leaf cells. Potentials were calculated assuming pH of 7.3 and 8.0 for cytosol and stroma, respectively60. Data shown are means ± SD of 131–253 cells. ****P ≤ 0.0001; two-way ANOVA, Bonferroni’s multiple comparisons test. b Light response of NERNST in tobacco leaf cells illuminated (Light) or not (Dark) at 200 μmol quanta m−2 s−1 for 3 h. ENADP(H) values were calculated assuming stromal pH of 7.2 and 8.0 for dark and light conditions, respectively61,62. Data shown are means ± SD of 12-363 cells. *P ≤ 0.05, ****P ≤ 0.0001; two-tailed Mann–Whitney test (Chloroplast) or Unpaired t test (Cytosol). c Drought responses of NERNST in tobacco leaf cells. Excised leaves were air-dried for 3 h, prior to NERNST imaging. Data shown are means ± SD of 12-356 cells. ****P ≤ 0.0001; two-tailed Mann–Whitney test (Chloroplast) or Unpaired t test (Cytosol). d Salt responses of NERNST-expressing tobacco leaf discs exposed to the indicated concentrations of NaCl for 16 h. Data shown are means ± SD of 12-229 cells. *P ≤ 0.05, ***P ≤ 0.001, ****P ≤ 0.0001; ns, non-significant; one-way ANOVA, Dunn’s multiple comparisons test (Chloroplast) or Bonferroni’s multiple comparisons test (Cytosol). e NERNST imaging of tobacco leaves inoculated with P. carotovorum at two distances from the infiltration site. Data shown are means ± SD of 10-175 cells. **P ≤ 0.01, ****P ≤ 0.0001; ns, non-significant; one-way ANOVA, Dunn’s multiple comparisons test. f Ratiometric images (R values) of roots from 14-day-old tobacco plants grown in 0.5×MS-agar. g Transiently-expressed NERNST in the chloroplasts and cytosol of N. benthamiana leaf cells. Right panels: merge between 488-nm and chlorophyll fluorescence. Representative images and data shown were produced in at least two independent experiments. Scale bars, 50 μm. b–f Pseudocolor scales = R values. Source data, including all precise n values and exact P values, are provided as a Source Data file.
|