
- Title
-
FK506-binding protein 5 regulates cell quiescence-proliferation decision in zebrafish epithelium
- Authors
- Li, Y., Liu, C., Bai, X., Li, M., Duan, C.
- Source
- Full text @ FEBS Lett.
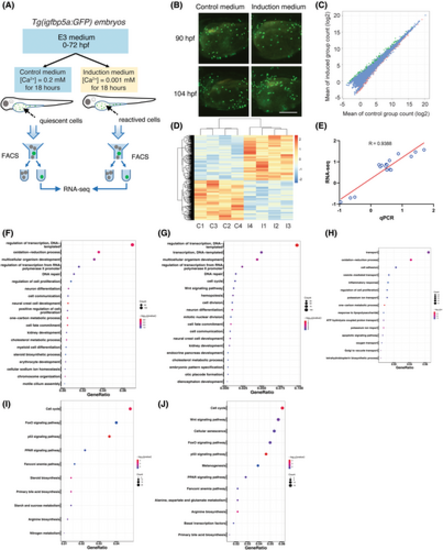
Identification and analysis of differentially expressed genes (DEGs). (A) The RNA-seq experiment design. (B) Representative images of Tg(igfbp5a:GFP) larvae at the indicated stages grown in the control medium or the induction medium. Shown here and in following figures are lateral views of the yolk sac region. Anterior to the left and dorsal up. Note clusters of newly divided NaR cells induced by the induction medium at 104 h post fertilisation (hpf). (C) Pairwise comparison of gene expression abundance between the control and the induced NaR cells. The up- and down-regulated genes were shown in green and red, respectively. Genes that were not changed are shown in blue. (D) Hierarchical clustering of the DEGs in the four control (C1–C4) and four induction groups (I1–I4) of NaR cells. Red colour indicates up-regulated genes and blue colour down-regulated genes. (E) qRT-PCR confirmation of RNA-seq data. Changes (log2) in the mRNA levels of the indicated genes measured by RNA-seq were plotted against those detected by qPCR. The line indicates the linear correlation between the results of RNA-seq and qPCR. (F–H) Gene ontology (GO) analysis results of all (F), up-regulated (G) and down-regulated (H) DEGs. The dot size indicates the number of genes, and the x-axis indicates the identified genes ratio in the relevant GO term. (I, J) Kyoto encyclopedia of genes and genomes (KEGG) analysis of all (I), and up-regulated (J). The dot size indicates the number of identified genes, and the x-axis indicates the genes ratio in the relevant KEGG pathway. |
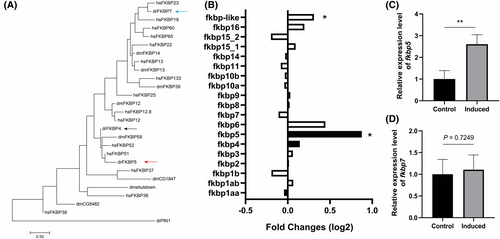
Up-regulation of fkbp5 expression in reactivated NaR cells. (A) Phylogenetic tree of humans (hs), zebrafish (dr) and Drosophila (dm) FKBPs. Pin1 prolyl cis–trans isomerase drPIN1is used as an outgroup. (B) Relative levels of fkbp mRNAs detected by RNA-seq. The mRNA levels of the indicated genes in reactivated NaR cells were normalised by those of the control NaR cells. Data shown are mean. *P < 0.05. (C) qRT-PCR results. NaR cells were isolated by fluorescence-activated cell sorting as described in Fig. 1. The mRNA level of fkbp5 (upper panel) and fkbp7 (lower panel) were detected by qRT-PCR and expressed as fold change over the control group. n = 4. Data shown are mean ± SD. ** indicates P < 0.01. |
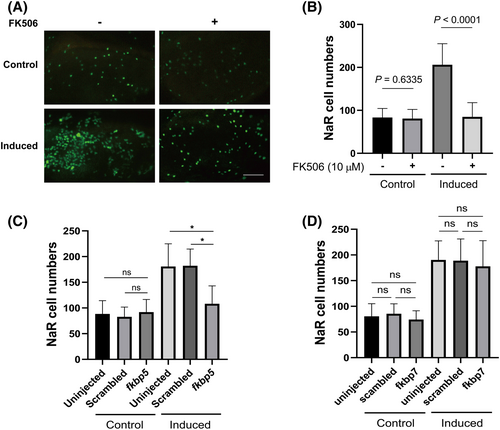
Fkbp5 promotes NaR cell quiescence-proliferation transition. (A, B) Effect of FK506. Tg(igfbp5a:GFP) embryos were raised in E3 medium to 3 dpf and transferred to the control and induction medium with or without 10 μm FK506. NaR cells were quantified at 5 dpf. Representative images were shown in (A) and quantified data in (B). Scale bar = 0.2 mm. Data shown are mean ± SD. n = 37~58. (C, D) Tg(igfbp5a:GFP) embryos were injected with Cas9 mRNA and gRNAs targeting fkbp5 (C), fkbp7 (D) or scrambled gRNA at the one-cell stage. They were raised in E3 solution to 3 dpf and transferred to the control (Control) or induction medium (induced). NaR cells were quantified 2 days later. Data shown are mean ± SD. n = 17 ~ 69. |
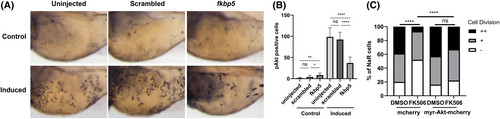
Fkbp5 promotes NaR cell quiescence-proliferation transition via Akt signalling. (A, B) Tg(igfbp5a:GFP) embryos were raised in E3 medium until 3 dpf and transferred to the control (Control) or induction medium (induced). Two days later, they were subjected to phospho-Akt immunostaining. Phospho-Akt-positive cells in the yolk sac region were quantified. Representative images were shown in (A) and quantified data in (B). Data shown are mean ± SD. (C) Effect of myrAkt expression. Tg(igfbp5a:GFP) embryos injected with BAC (igfbp5a:mCherry) or BAC (igfbp5a:myr-Akt-mCherry) were raised. At 3 dpf, they were transferred to the induction medium containing DMSO or 10 mm FK506. At 5 dpf, NaR cells labelled by both GFP and mCherry were scored following a previously established scoring system [[21]]. NaR cells that that did not divide, divided one time or two times are scored as −, + and ++, respectively. *P < 0.05; ****P < 0.0001; ns, not significant. Total cell number is shown above each column. |