
|
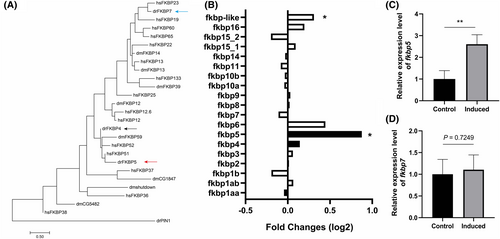
Fig. 2 Up-regulation of fkbp5 expression in reactivated NaR cells. (A) Phylogenetic tree of humans (hs), zebrafish (dr) and Drosophila (dm) FKBPs. Pin1 prolyl cis–trans isomerase drPIN1is used as an outgroup. (B) Relative levels of fkbp mRNAs detected by RNA-seq. The mRNA levels of the indicated genes in reactivated NaR cells were normalised by those of the control NaR cells. Data shown are mean. *P < 0.05. (C) qRT-PCR results. NaR cells were isolated by fluorescence-activated cell sorting as described in Fig. 1. The mRNA level of fkbp5 (upper panel) and fkbp7 (lower panel) were detected by qRT-PCR and expressed as fold change over the control group. n = 4. Data shown are mean ± SD. ** indicates P < 0.01.