
- Title
-
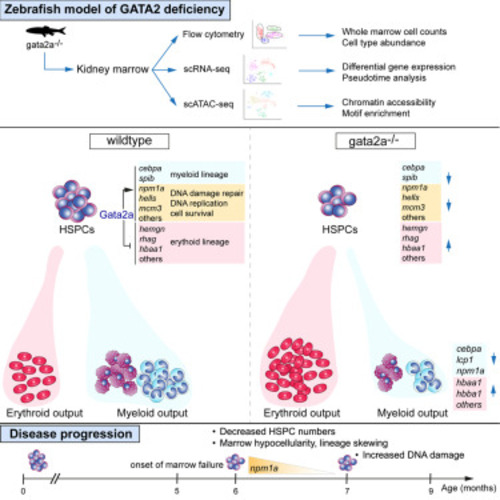
Lineage skewing and genome instability underlie marrow failure in a zebrafish model of GATA2 deficiency
- Authors
- Mahony, C.B., Copper, L., Vrljicak, P., Noyvert, B., Constantinidou, C., Browne, S., Pan, Y., Palles, C., Ott, S., Higgs, M.R., Monteiro, R.
- Source
- Full text @ Cell Rep.

Loss of gata2a results in hypocellular marrow, neutropenia, B lymphopenia, and erythrocytosis at 6 mpf (A) WKM smears and May Grunwald/Giemsa staining at 4, 5, and 6 mpf. Scale bar, 10 μm. (B) Total WKM cell counts at 4 (n = 8/condition [biological replicates]), 5 (n = 6/condition [biological replicates] except gata2a−/−, where n = 5) and 6 mpf (n = 10/condition [biological replicates] except gata2a−/−, where n = 11). Error bars are mean ± SD. (C) Flow cytometry gating strategy. (D–G) Analysis of different lineages using either mpx:GFP, mpeg1:GFP, or gata1:dsRed transgenic lines. We examined neutrophils (mpx:GFP, myeloid gate),15 macrophages (mpeg1.1:GFP, myeloid gate), B cells (mpeg1.1:GFP, lymphoid gate),16 and erythrocytes (gata1:dsRed, erythroid gate)17 at 6 mpf. (D) gata2a+/+ vs. gata2a+/−: p = 0.82, gata2a+/+ vs. gata2a−/−: p = 0.0024, n = 3/condition (biological replicates). (E) gata2a+/+ vs. gata2a+/−: p = 0.87, gata2a+/+ vs. gata2a−/−: p = 0.64, n = 4/condition (biological replicates). (F) gata2a+/+ vs. gata2a+/−: p = 0.053, gata2a+/+ vs. gata2a−/−: p = 0.0145, n = 8/condition (biological replicates) except gata2a−/−, where n = 6. (G) gata2a+/+ vs. gata2a+/−: p = 0.0374, gata2a+/+ vs. gata2a−/−: p = 0.0146, n = 3/condition (biological replicates) except gata2a+/−, where n = 4. Analysis was completed using one-way ANOVA, not significant (NS) p > 0.05, ∗p < 0.05. (B and D–G) Each dot represents one sample. Data shown as mean ± SD. |
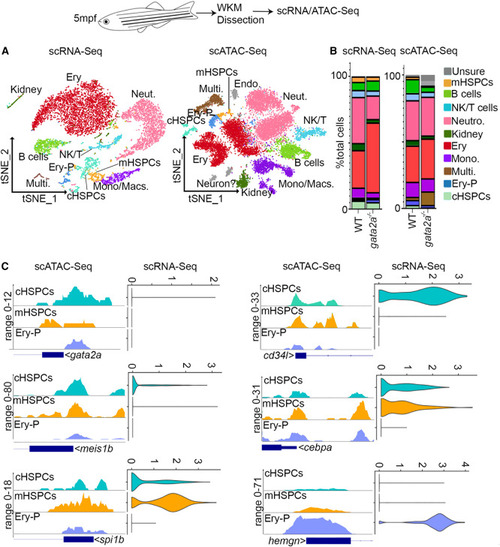
gata2a is required for lineage specification and transcriptional regulation in WKM hematopoietic populations (A) scRNA-seq (left) and scATAC-seq (right) t-distributed stochastic neighbor embedding (tSNE) clustering of WKM hematopoietic populations. Analysis estimated 3,047 WT cells and 5,584 gata2a−/− cells for scRNA-seq (from 3 WT/gata2a−/− fish pooled to give one WT/mutant [MUT] sample that was sequenced) and 10,004 WT cells and 6,500 gata2a−/− cells for scATAC-seq (n = 3/condition [biological replicates]). Multi, multiciliated kidney (stromal) cells; cHSPCs, core HSPCs; Neut, neutrophils; NK/T, natural killer and T cells; Mono/Macs, monocytes/macrophages; Ery, erythroytes; mHSPCs, myeloid-biased HSPCs; Ery-P, erythroid progenitors; Endo, endothelial cells. Full list of differentially expressed genes can be found in Table S2. (B) Percentage of WKM populations of total WT or gata2a−/− cells. (C) Chromatin accessibility near promoter regions (scATAC-seq) and RNA expression (scRNA-seq, RNA assay) of indicated genes. Each dot represents a cell. cHSPC, core HSPC; mHSPC, myeloid-biased HSPC; Ery-P, erythroid progenitors. See also Figures S1 and S2 and Tables S1 and S5. |

Differential regulation of chromatin accessibility and myeloid and erythroid gene expression by Gata2a in cHSPCs and mHSPCs (A and B) Volcano plots of log2 fold change in gene expression vs. –log10(p value) in mHSPCs and cHSPCs. Each dot represents a gene. Dotted line indicates p = 0.05 and fold change = 0.25 with black genes falling below this threshold. (C) GO term enrichment (performed using https://metascape.org ) analysis of up- or downregulated genes in mHSPCs with a p <0.05. mHSPCs, myeloid HSPCs. Full list of differentially expressed genes can be found in Table S2. (D and E) Chromatin accessibility near promoter regions (scATAC-seq) and RNA expression (scRNA-seq) of indicated genes in either cHSPCs (D) or mHSPCs (E). In (D), WT vs. gata2a−/−: cebpa p = 3.36E−10; npm1a p > 0.05; lcp1 p = 3.32E−15; hbba1.1 p = 3.72E−18; hemgn p > 0.05. In (E), WT vs. gata2a−/−: cebpa p = 0.00039; npm1a p = 0.034; lcp1 p = 1.5E−15; hbba1.1 p = 8.13E−8; hemgn p = 0.00085. cHSPC, core HSPC. mHSPCs, myeloid HSPCs. NS p > 0.05, ∗p < 0.05, ∗∗p < 0.01, ∗∗∗∗p < 0.0001. See also Figure S3 and Table S2. |
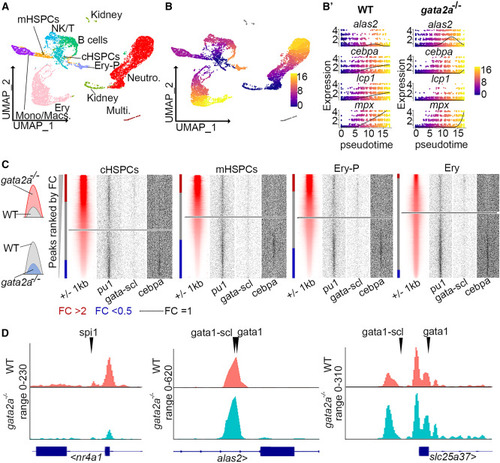
Chromatin accessibility alterations in gata2a−/− HSPCs promote erythrocyte differentiation at the expense of the myeloid lineage (A) Uniform manifold approximation and projection (UMAP) of scRNA-seq data (from Figure 2A) with cell-type labels. (B) Pseudotime ordering of cells and (B′) expression of alas2, cebpa, lcp1, and mpx in each cell with pseudotime progression. (C) Heatmaps showing peaks ranked by fold change when comparing gata2a−/− and WT cells. Red bars depict peaks of FC >2 and blue when FC <0.5. Dotted line indicates FC = 1. FC, fold change; cHSPC, core HSPC; mHSPCs, myeloid HSPCs; Ery-P; erythroid progenitors; Ery, erythrocytes. (D) Open (FC > 0.2) and closed (FC < −0.2) peaks from erythrocytes were scanned by HOMER for the indicated motifs and sites are indicated by arrowheads. See also Table S6. |
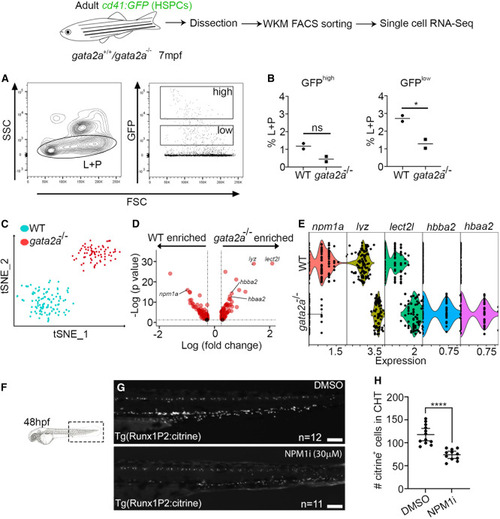
Severe npm1a downregulation in gata2a−/− HSPCs at 7 mpf (A) FACS gating strategy to analyze/isolate cd41:GFPlow HSPCs from 7 mpf adults. L, lymphoid cells; P, progenitor cells. (B) Two cd41:GFP and two cd41:GFP;gata2a−/− adults at 7 mpf and sorted live CD41:GFPlow cell analysis of GFPhigh and GFPlow fractions. GFPhigh: p = 0.0783, GFPlow: p = 0.0409, determined using a two-tailed unpaired t test. (C) scRNA-seq and tSNE clustering of WT and gata2a−/− HSPCs. We chose cells with at least 1,000 UMI counts (106 WT and 72 gata2a−/− cells) and then exported extracted barcoded reads to be retained for further analysis in cell ranger/Loupe/R. (D) Volcano plots of log2 FC vs. –log10(p value). Full list of differentially expressed genes in Table S4. (E) Violin plot (each dot represents a single cell) of npm1a, lyz, lect2l, hbba2, and hbaa2 expression in WT and gata2a−/− HSPCs. gata2a−/− vs. WT: npm1a; p = 1.06E−16. (F) Imaging schematic. lyz: p = 1.15E−29; lect2l: p = 8.76E−30; hbba2: p = 5.3E−15; hbaa2: p = 1.73E−13. (G) Imaging of the caudal haematopoietic tissue (CHT) region of Tg(Runx1p2:Citrine)+ embryos at 48 hpf. Scale bar, 100 μm. (H) Quantification. Error bars are mean with 95% confidence interval (CI). DMSO: n = 12 (biological replicates), NPM1i: n = 11 (biological replicates). ∗∗∗∗p < 0.0001, determined using a Mann-Whitney test. See also Tables S4, S7, and S8. |
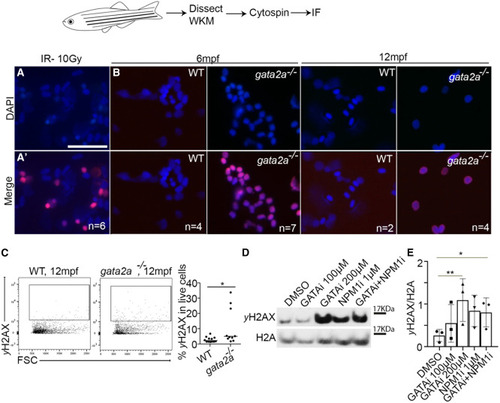
Loss of gata2a leads to increased DNA damage and mutation burden in WKM of gata2a−/− MUTs (A and A′) Control irradiation performed at 10 Gy on WKM cells and immunofluorescence against DAPI and γH2AX. Scale, 25 μm. (B) WKM from 6 and 12 mpf WT or gata2a−/− adults and immunofluorescence against DAPI and γH2AX. Imaging is at 40× magnification. (C) Flow cytometry analysis of γH2AX expression in 12 mpf WKM. p = 0.0296, WT: n = 12 (biological replicates), gata2a−/−: n = 10 (biological replicates). (D) Western blot of γH2AX and H2A (loading control) in HPC7 cells after 1 μM NSC348884 (NPM1 inhibitor43) or 100/200 μM pyrrothiogatain (GATA inhibitor49) treatment for 24 h. (E) Quantification of western blot data, n = 3/condition (biological triplicates). ∗p < 0.05, determined by using an unpaired, two-tailed t test in (C). ∗∗p < 0.01 and ∗p < 0.05, determined by Friedman test in (E). See also Figure S6. |
|