
Fig. 4
- ID
- ZDB-FIG-240112-38
- Publication
- Mahony et al., 2023 - Lineage skewing and genome instability underlie marrow failure in a zebrafish model of GATA2 deficiency
- Other Figures
- All Figure Page
- Back to All Figure Page
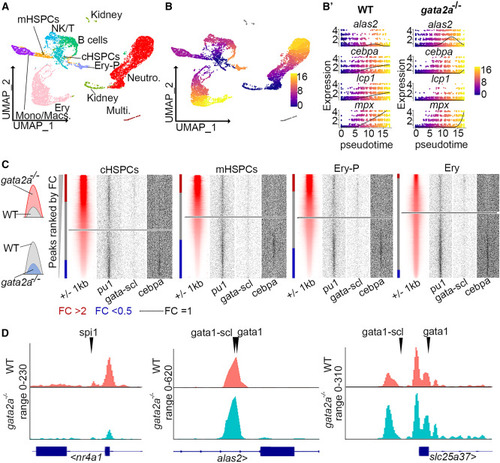
Chromatin accessibility alterations in gata2a−/− HSPCs promote erythrocyte differentiation at the expense of the myeloid lineage (A) Uniform manifold approximation and projection (UMAP) of scRNA-seq data (from Figure 2A) with cell-type labels. (B) Pseudotime ordering of cells and (B′) expression of alas2, cebpa, lcp1, and mpx in each cell with pseudotime progression. (C) Heatmaps showing peaks ranked by fold change when comparing gata2a−/− and WT cells. Red bars depict peaks of FC >2 and blue when FC <0.5. Dotted line indicates FC = 1. FC, fold change; cHSPC, core HSPC; mHSPCs, myeloid HSPCs; Ery-P; erythroid progenitors; Ery, erythrocytes. (D) Open (FC > 0.2) and closed (FC < −0.2) peaks from erythrocytes were scanned by HOMER for the indicated motifs and sites are indicated by arrowheads. See also Table S6. |