
- Title
-
WDR31 displays functional redundancy with GTPase-activating proteins (GAPs) ELMOD and RP2 in regulating IFT complex and recruiting the BBSome to cilium
- Authors
- Cevik, S., Peng, X., Beyer, T., Pir, M.S., Yenisert, F., Woerz, F., Hoffmann, F., Altunkaynak, B., Pir, B., Boldt, K., Karaman, A., Cakiroglu, M., Oner, S.S., Cao, Y., Ueffing, M., Kaplan, O.I.
- Source
- Full text @ Life Sci Alliance
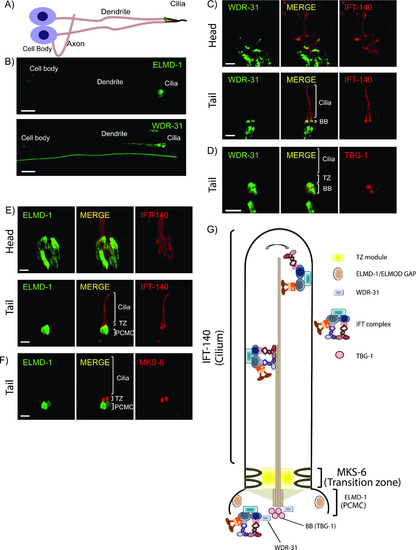
(A,B) Shown are the representative drawing of the PHA/PHB sensory neuron (phasmid neurons located in the tail). Cilia, dendrites, axons, and cell soma (cell body) are depicted in the drawing. Fluorescence images from the transgenic strain carrying WDR-31::GFP or GFP::ELMD-1 were displayed in the PHA/PHB sensory neurons. Scale bars: 3 μm. (C, D) Co-localization of WDR-31::GFP (Green) with the IFT-140::mCherry (Red, an IFT-A component, a ciliary marker) or TBG-1:mKate (Red, γ-Tubulin, the basal body) in the tail (phasmids) and head (amphid) sensory neurons. (E, F) TZ and BB denote the transition zone and the basal body, respectively (E, F) GFP::ELMD-1 (Green) localizes to the BB and PCMC (the periciliary membrane compartment) proximal to the transition zone. Co-labelling of GFP::ELMD-1 with MKS-6:mCherry marker (transition zone) or IFT-140::mCherry in the tail (phasmids) and head (amphid) neurons. Scale bars: 2 μm. (G) Shown are representative localizations of WDR-31 and ELMD-1. |
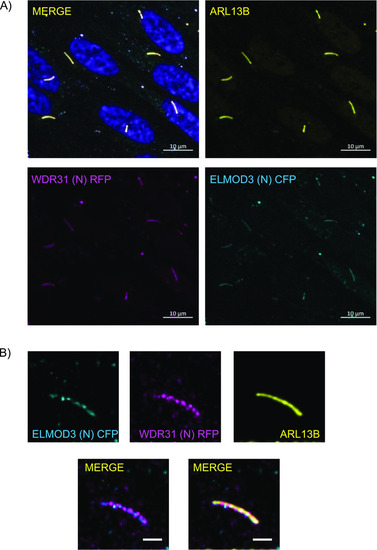
(A, B) Shown are the staining of WDR31 (tagged with cyan fluorescent protein) and ELMOD3 (tagged with red fluorescent protein) together with a ciliary marker ARL13B and DAPI (nucleus) in hTERT-RPE1 cells. hTERT-RPE1 cells were transiently transfected with 100 ng of WDR31:CFP and ELMOD3:RFP. (A, B) Scale bars: 10 μm (A) and 3 μm (B). |
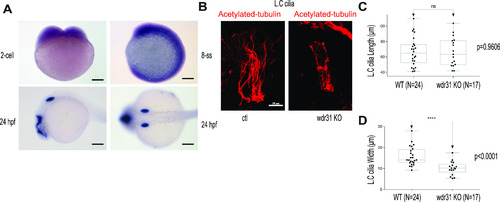
(A) Shown is the expression pattern analysis of wdr31 in zebrafish embryos. wdr31 is ubiquitously expressed before the segmentation stage (two-cell and eight-somite stages [SS]). The expression of wdr31 becomes limited to the otic vesicle and brain region at 24 hours post fertilization (24 hpf). (B) Shown are the cilia of lateral crista (LC) of the otic vesicle, stained with acetylated-tubulin, in WT and wdr31 knockout, generated via CRISPR/Cas9. (C, D) The length of cilia in the LC of the otic vesicle remains unaffected in zebrafish wdr31 knockout, whereas the cilia number is decreased, as shown with the measurement of width of cilia LC of the otic vesicle. PHENOTYPE:
|
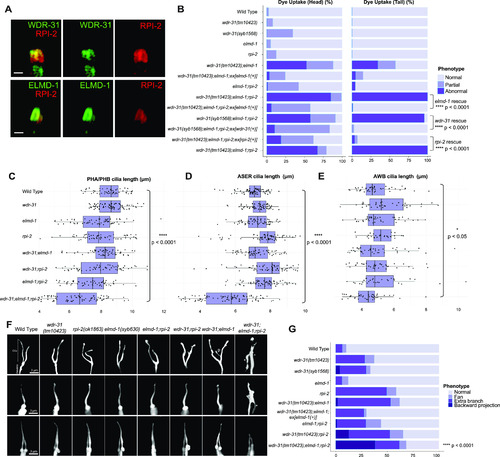
(A) Shown are co-localizations of RPI-2::mCherry (red, the endogenously labeled RPI-2) with either WDR-31::GFP (green, the endogenously labeled WDR-31) or GFP::ELMD-1 (green, overexpressed) in tail (phasmid) sensory neurons in C. elegans. Scale bars: 1 μm. (B) The fraction of the dye uptake defects is presented in bar charts for WT and the indicated mutants. Fisher’s exact test was performed for statistical analysis between the indicated triple mutants and a rescue gene for Dye assay. Brackets show statistical significance between two strains compared (P < 0.0001 and **** indicate statistical significance). (C, D, E) Shown is the jitter plot for PHA/PHB cilia, ASER cilia, and AWB short cilia length (μm) for WT and indicated mutant strains. Statistical significance between WT and triple mutants was shown with bracket. **** implies statistical significance, which means that P value is lower than P < 0.0001, whereas * means that P-value is lower than P < 0.05. (F) Fluorescence images show the morphology of AWB cilia (fork-like structure located in the head), ASER cilia (amphid channel cilia), and PHA/PHB cilia (phasmid channel cilia) in WT and indicated mutant backgrounds. The backward projection from the cilia is shown with asterisks (*), whereas p indicates the ectopic projections from the middle parts of cilia. Scale bars: 3 μm. (G) The percentage of the abnormality in AWB cilia morphology is depicted in bar charts. Fisher’s exact test was used for statistical analysis of AWB cilia morphology between WT and designated mutants, and **** denotes statistical significance. |
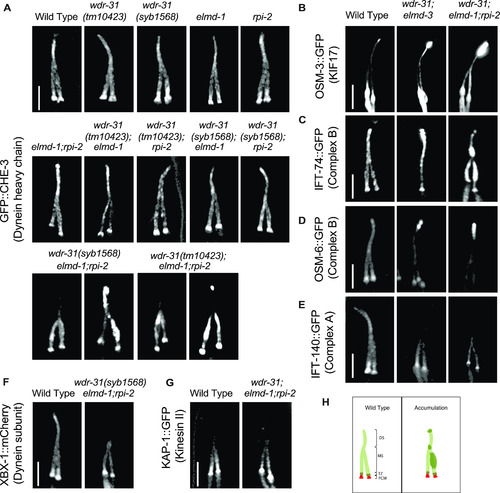
Shown are fluorescent images of PHA/PHB cilia (phasmid tail). (A) Fluorescent images from a single copy GFP::CHE-3 (human dynein heavy chain DYNC2H1) in WT and indicated mutant backgrounds are displayed. GFP::CHE-3 accumulations within cilia and dim distal cilia staining were observed in two distinct triple mutants (wdr-31(tm10423);elmd-1;rpi-2 and wdr-31(syb1568);elmd-1;rpi-2). Scale bars: 3 μm. (B, C, D, E, F) Confocal microscopy analysis of IFT-A (IFT-140::GFP) and IFT–B complex components (OSM-6/IFT52::GFP and IFT-74::GFP) revealed differential abnormalities in the transport of IFT-A and IFT-B components in double (wdr-31;elmd-1) and triple mutants. The localization of XBX-1::mCherry (Dynein subunit) in wdr-31(syb1568);elmd-1;rpi-2 triple mutants phenocopies the dim distal cilia staining of IFT-A (IFT-140::GFP) in the wdr-31(tm10423);elmd-1;rpi-2 triple mutants. OSM-3/KIF17 Kinesin motor accumulates at the ciliary tips in wdr-31(tm10423);elmd-1 double and wdr-31(tm10423);elmd-1;rpi-2 triple mutants. Compared with double mutants, the ciliary tip staining is stronger in the triple mutants. Scale bars: 3 μm. (G) Fluorescent images from Kinesin II motor (KAP-1::GFP) revealed that the restricted middle segment localization of KAP-1 remains unchanged in wdr-31(tm10423);elmd-1;rpi-2 triple mutants. Scale bars: 3 μm. (H) Shown are the drawings of phasmid cilia (PHA/PHB sensory neurons in the tail) in WT and mutants showing ciliary accumulations. |
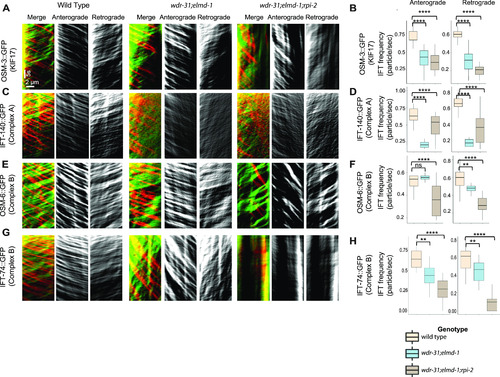
(A, C, E, G) Shown are representative kymographs of GFP-tagged IFT proteins translocating in the tail cilia (PHA/PHB sensory neurons) of WT and indicated mutants. Kymographs for anterograde, retrogrades, and merged (Red & Green) were generated with ImageJ equipped with KymographClear. The trajectory represents a moving IFT particle, and the average number of moving IFT particles in WT and indicated mutants (double, triple) was calculated by counting all trajectories in each kymograph. Travel time and distance are shown on kymographs. (B, D, F, H) Box-and-Whisker charts with error bars were created to visualize the average number of IFT anterograde and retrograde particles between WT and indicated mutants. The Mann–Whitney U test was used to measure statistical analysis and significance. The four and three asterisks (**** and ***) at the top of the brackets indicate that the P-value between the two strains is less than 0.0001 and 0.001, respectively, suggesting statistical significance. Ns stands for “not significant.” |
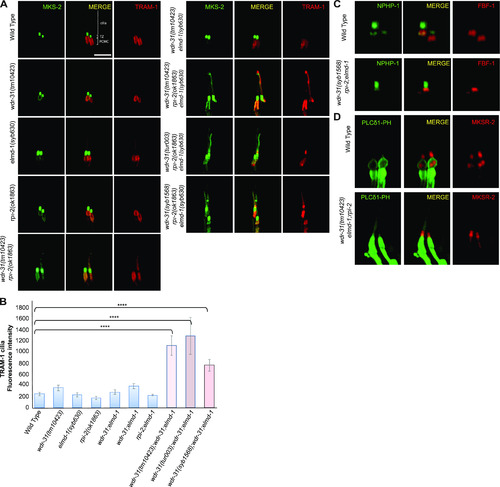
(A) Confocal fluorescent images exhibit the localization of tdTomato-tagged TRAM-1 (a PCMC marker) and MSK-2::GFP (a TZ marker) in WT and indicated mutants. TRAM-1 leaks into the cilia in all three wdr-31 triple mutants. Cilia, the periciliary membrane compartment (PCMC), and transition zone (TZ) are depicted in the fluorescent image. Scale bars: 2 μm, (B) TRAM-1 fluorescence intensities in the cilia were measured in WT and designated mutants, and the results were shown in the plot. The four asterisks (****) indicate statistically significant differences between the WT and the identified triple mutants. (C, D) The localization of NPHP-1::GFP (a transition zone protein) and FBF-1::mCherry (a transition fiber protein) was similar unaffected in wdr-31;elmd-1;rpi-2 triple mutants (D) The PLCδ1-PH::GFP (a marker for monitoring phosphatidylinositol 4,5-bisphosphate (PtdIns(4,5)P2) in the plasma membrane) decorates the membranes of PCMC and does not enter into the cilia in WT. MKSR-2 was used to mark the transition zone. The PLCδ1-PH::GFP stays outside of the cilia in the wdr-31;elmd-1;rpi-2 triple mutants. |
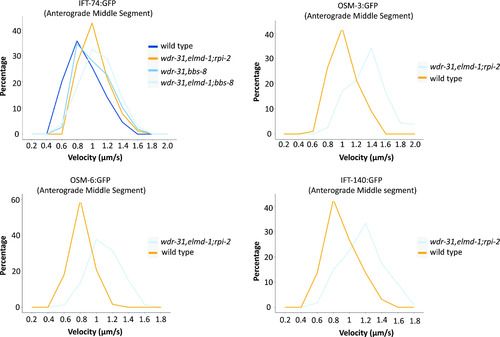
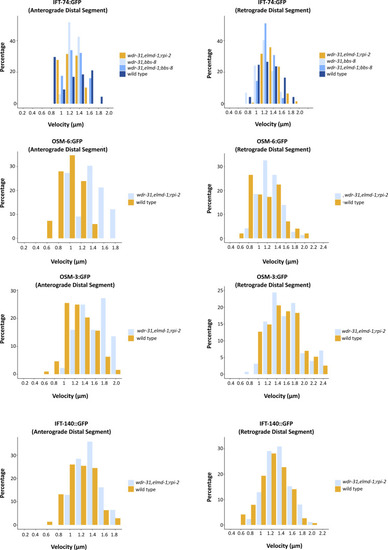
The percentage distribution (particles) of the indicated IFT velocities (anterograde middle segment) in the WT and corresponding mutants is shown in the velocity versus percentage line graphs. The complete list of proteins that interact with WDR31 and ELMOD3 is provided in Table S2. |
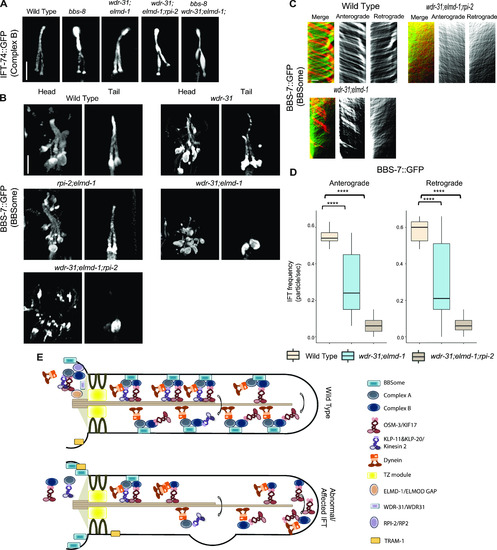
(A) Shown are fluorescence images from the transgenic strain carrying IFT-74::GFP, an IFT-B component, in WT, wdr-31;elmd-1 double mutants, wdr-31;elmd-1;rpi-2 and wdr-31;elmd-1;bbs-8 triple mutants, and bbs-8(nx77). The IFT-B subunit IFT-74:GFP accumulates at the ciliary tips and cilia in the tails of all three mutants. (B) Confocal fluorescence images showing the localization of BBS-7:GFP, a BBSome subunit, in the heads and tails of WT and wdr-31(tm10423); wdr-31;elmd-1; rpi-2;elmd-1 double and wdr-31;elmd-1;rpi-2 triple mutants. Fluorescence images showed absent or weak cilia staining of BBS-7::GFP in both the heads and tails of wdr-31;elmd-1 and wdr-31;elmd-1;rpi-2 triple mutants. (C) Kymographs were created from time-lapse BBS-7::GFP movies (PHA/PHB cilia) using KymographClear integrated into ImageJ. Shown are representative kymographs for BBS-7::GFP translocating in WT and indicated mutants. Each trajectory in kymographs was counted. (D) Travel time and distance are included on kymograph (D) The graph depicts the average number of BBS-7::GFP particles traveling around the cilia in both directions for WT and indicated mutants. (E) The Mann–Whitney U test revealed statistical significance between the compared strains and that the P-value was less than 0.0001 shown by the four asterisks (****) at the top of the brackets (E) In WT, the assembly of the Kinesin–IFT-–BBSome complex (Kinesin-II and OSM-3, IFT-B, IFT-A, and BBSome) happens at the base of the cilia. In the middle segment of amphid and phasmid cilia in C. elegans, both heterotrimeric Kinesin II and homodimeric OSM-3 transport the IFT-A–IFT-B–BBSome complex in an anterograde direction. Heterotrimeric Kinesin II returns to the ciliary base when it reaches the tip of the middle segment of amphid and phasmid cilia, whereas homodimeric OSM-3 is responsible for the anterograde translocation of the IFT–BBSome complex in the distal segment of amphid and phasmid cilia. When the OSM-3–IFT–BBSome complex reaches the ciliary tip, cytoplasmic dynein transports them back to the ciliary base. In wdr-31;elmd-1 double wdr-31;elmd-1;rpi-2 triple mutants, the BBSome failed to enter into the cilia, thus leading to accumulations of OSM-3 and IFT-B components in the ciliary tips. |
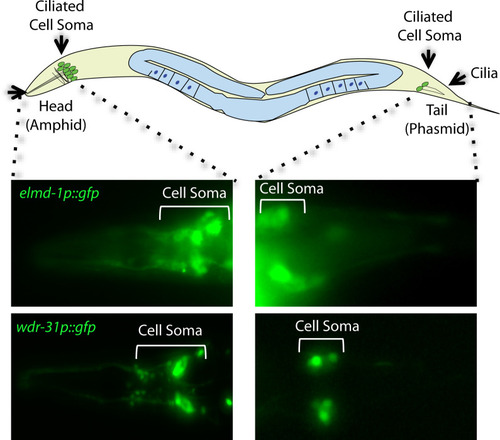
A total of 60 sensory neurons are distributed in the head (amphid) and tails (phasmid) of |
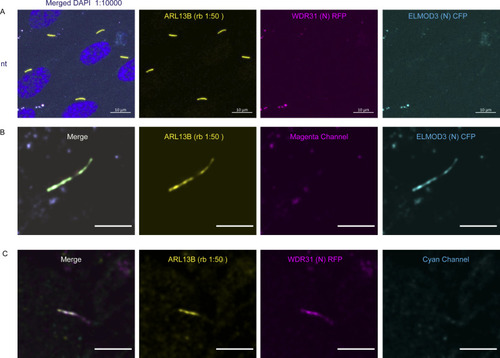
(A) Images showing immunostaining of a ciliary marker ARL13B and DAPI (nucleus) in hTERT-RPE1 cells. NT represents no transfection of hTERT-RPE1 with WDR31 (tagged with cyan fluorescent protein) and ELMOD3 (tagged with red fluorescent protein). Scale bars: 10 μm. (B) Images showing immunostaining of hTERT-RPE1 cells transfected with ELMOD3-CFP (cyan) and also stained for ARL13B (yellow). The magenta channel only shows some background but no localization to the cilium. Green regions in the “merge” picture show co-localization of both ELMOD3 and ARL13B proteins. Scale bars: 3 μm. (C) Fluorescence images displaying hTERT-RPE1 Fluorescence images of immunostaining for ARL13B (yellow) and WDR31-RFP (magenta) in hTERT-RPE1 cells transfected with WDR31-RFP (cyan). The cyan channel shows some background, with no cilium localisation. WDR31 and ARL1B proteins are co-localized in the pink sections of the “merge” image. Scale bars: 3 μm. |
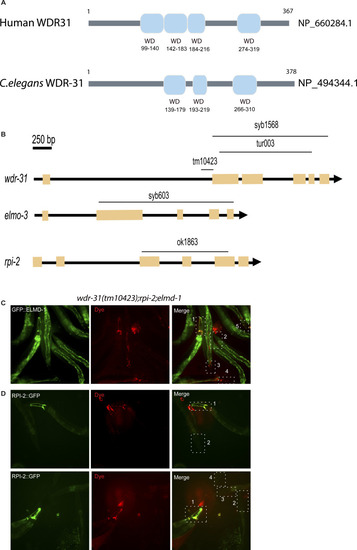
(A) Shown are representative schematics of human and C. elegans WDR-31/WDR31. Human WDR31 (NP_660284.1) has four WD domains, whereas C. elegans WDR-31 (NP_494344.1) has three WD domains (https://prosite.expasy.org/; [Sigrist et al, 2013]). (B) Schematic diagrams of wdr-31, elmd-1, and rpi-2 together with corresponding deletions are shown. Scale bars: 250 bp. (C, D) Fluorescence microscope images of mutant worms (head and tail) with red-fluorescent dye uptake (Texas red filter) and GFP-tagged ELMD-1 and RPI-2 (fluorescence filter set for GFP) are shown. The head or tail in the dotted lines is indicated by numbers in the combined fluorescence images. GFP expression in combination with RED fluorescence indicates the rescue of dye uptake defects. |
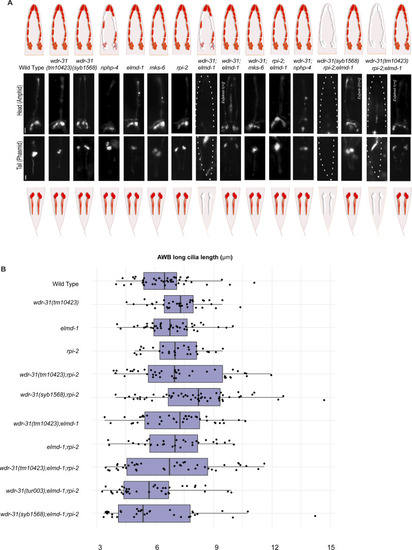
(A) Shown are the schematic representations of lipophilic fluorescent dye uptake in the head (amphid) and tail (phasmid) sensory neurons in C. elegans. Red labelling indicates the normal dye uptake, whereas the failure of dye uptake was shown in white. Fluorescence images show the dye update in the head and tail neurons in the WT and indicated mutant strains. No dye uptake was observed in both head (amphid) and tail (phasmid) of wdr-31(tm10423);elmd-1 double mutants, wdr-31(tm10423);elmd-1;rpi-2 and wdr-31(syb1568);elmd-1;rpi-2 triple mutants. Ex[elmd-1(+)] rescues the dye uptake defects of wdr-31(tm10423);elmd-1 double and wdr-31(tm10423);elmd-1;rpi-2 triple mutants, whereas Ex[wdr-31(+)] rescues the dye uptake defects of wdr-31(syb1568);elmd-1;rpi-2 triple mutants. Scale bars: 10 μm. (B) Shown is the jitter plot for AWB long cilia length (μm) in WT and mutant strains. |
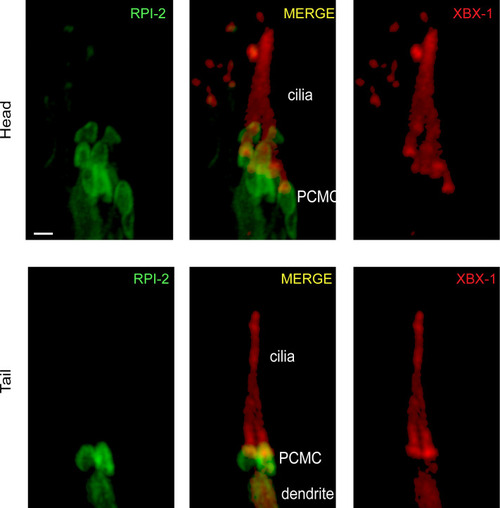
Shown is co-localization of RPI-2::GFP (human RP2) and XBX-1::mCherry (human DYNC2LI1) in the head and tail sensory neurons. XBX-1 stains the entire cilium and is used as a ciliary marker, whereas RPI-2 is located at PCMC. PCMC denotes the periciliary membrane compartment. |
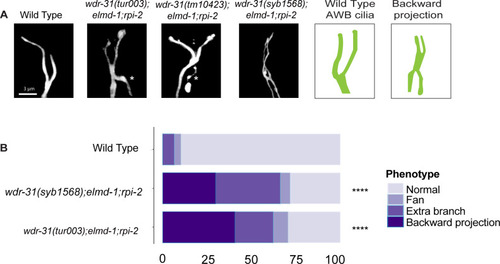
(A) The architecture of AWB cilia (a fork-like structure in the head) in WT and mutant backgrounds is shown in fluorescent images. In schematic illustrations, the AWB cilia in WT and altered mutants are illustrated. (B) Shown are bar plots displaying the percentage of phenotypes in WT and indicated triple mutants. Four asterisks (****) indicates statistical significances between WT and indicated triple mutants. |
|
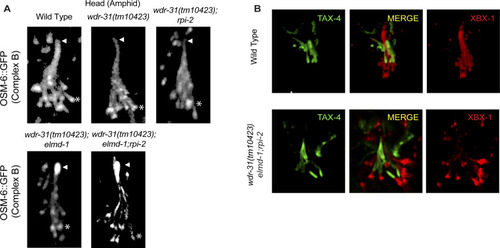
(A) Confocal images (Z-stack) display the localization of OSM-6::GFP (a single copy transgene, huma IFT52) in the head (a bunch of cilia) of WT and indicated mutants. Arrows point the ciliary tips, whereas asterisks indicate the ciliary base. (B) Confocal images show colocalization of TAX-4 (a ciliary membrane protein) and XBX-1::tdTomato (a cilia marker). |
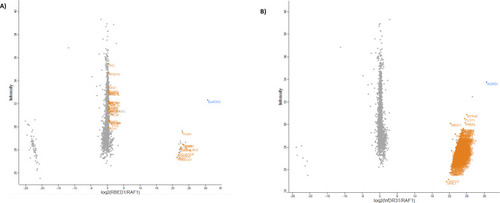
The orange highlights indicate the hits, but they are marginally failed t test and/or significance. |