
Figure 6.
- ID
- ZDB-FIG-230523-33
- Publication
- Cevik et al., 2023 - WDR31 displays functional redundancy with GTPase-activating proteins (GAPs) ELMOD and RP2 in regulating IFT complex and recruiting the BBSome to cilium
- Other Figures
- All Figure Page
- Back to All Figure Page
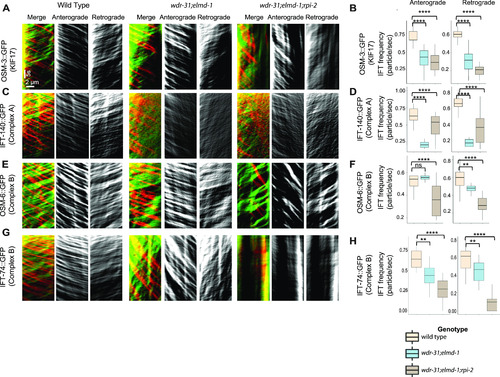
(A, C, E, G) Shown are representative kymographs of GFP-tagged IFT proteins translocating in the tail cilia (PHA/PHB sensory neurons) of WT and indicated mutants. Kymographs for anterograde, retrogrades, and merged (Red & Green) were generated with ImageJ equipped with KymographClear. The trajectory represents a moving IFT particle, and the average number of moving IFT particles in WT and indicated mutants (double, triple) was calculated by counting all trajectories in each kymograph. Travel time and distance are shown on kymographs. (B, D, F, H) Box-and-Whisker charts with error bars were created to visualize the average number of IFT anterograde and retrograde particles between WT and indicated mutants. The Mann–Whitney U test was used to measure statistical analysis and significance. The four and three asterisks (**** and ***) at the top of the brackets indicate that the P-value between the two strains is less than 0.0001 and 0.001, respectively, suggesting statistical significance. Ns stands for “not significant.” |