FIGURE SUMMARY
Title

EmbryoNet: using deep learning to link embryonic phenotypes to signaling pathways

Authors
Čapek, D., Safroshkin, M., Morales-Navarrete, H., Toulany, N., Arutyunov, G., Kurzbach, A., Bihler, J., Hagauer, J., Kick, S., Jones, F., Jordan, B., Müller, P.
Source
Full text @ Nat. Methods

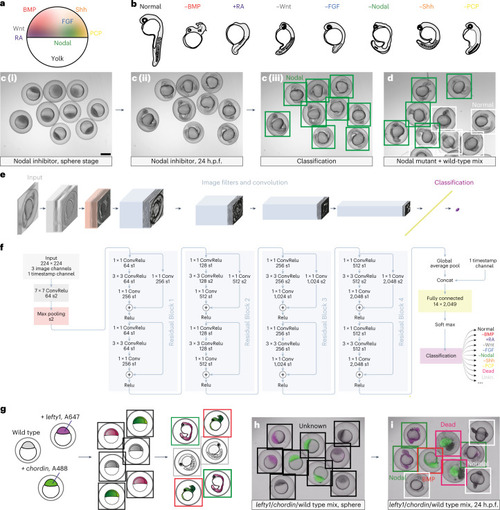
The CNN EmbryoNet robustly identifies molecular defects based on phenotype data.

a, Simplified schematic of signaling domains during zebrafish development projected onto an early embryo. b, Schematic drawings of zebrafish embryo phenotypes. −BMP loss of function causes reduced and often curled tails, +RA gain-of-function embryos lack head structures and have shortened tails, −Wnt leads to enlarged heads and shortened tails, −FGF causes loss of mesoderm and tail tissue, −Nodal embryos lack mesoderm and have cyclopia, −Shh embryos frequently have mispatterned somites and cyclopia, and −PCP leads to a shortened and widened body axis, manifested, for example, by shorter somites. c,d, Treatment with the chemical Nodal inhibitor SB-505124 caused specific phenotypes that were not yet apparent at sphere stage (c (i)), but which were clearly visible at segmentation stages (c (ii)); n = 36. The inhibitor treatment (c (iii)) phenocopied the MZoep (d) mutant, and both phenotypes were robustly identified by EmbryoNet; n = 58. e,f, Schematic overview of the neural network architecture with convolutional (Conv) layers shown in blue. Stack sizes after each image filter are illustrated in e, whereas f details the filters of the network. Relu, rectified linear unit. gi, EmbryoNet correctly classified embryos in a mixed population. g, Experimental set-up. Embryos at the one-cell stage were injected with mRNA encoding the Nodal inhibitor Lefty1 and Alexa647-labeled dextran (magenta), mRNA encoding the BMP inhibitor Chordin and Alexa488-labeled dextran (green), or were left uninjected (wild type) and then imaged. Black bounding boxes indicate the class Unknown; green indicates −Nodal; red indicates −BMP; white indicates Normal and magenta indicates Dead. h, At the sphere stage, EmbryoNet labeled the phenotypes as Unknown. Dextran-labeling shows the applied treatment. i, During segmentation stages the Normal, −BMP and −Nodal samples were correctly identified by EmbryoNet. The classification is in accordance with the dextran colors; n = 85. Scale bar, 500 µm.

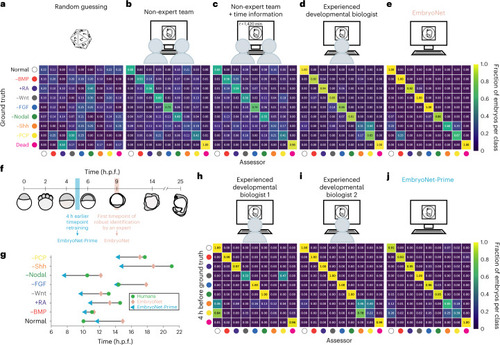
Classification of 98 single embryo images by non-expert teams, experienced researchers and EmbryoNet

ae, Schematic set-ups and confusion matrices showing the classification of the respective labeler compared with the ground truth (human annotation, treatment known). Classification performance is shown as a heatmap and fractions of 1 for the classification of 98 single images by a pseudo-random number generator (a), by a non-expert team without (b) or with (c) additionally provided time information (average performance), by an experienced researcher (d) and by EmbryoNet (e). f, Schematic of embryo detection over time. To allow for earlier detection, we annotated the training data 4 h before (blue time frame) the timepoint at which they could be robustly annotated by a labeler aware of the treatment (pink time frame). The embryo sketches show the phenotype of Nodal-inhibited samples at the respective time. The resulting network with earlier detection was termed ‘EmbryoNet-Prime’. g, Characteristic times of detection for each class based on the assessment of human experts, EmbryoNet and EmbryoNet-Prime. nNormal = 74, n−BMP = 119, n+RA = 66, n−Wnt = 70, n−FGF = 74, n−Nodal = 110, n−Shh = 63, n−PCP = 57. hj, Classification performance in the early detection of phenotypes. Confusion matrices show the classification of image series by the respective labeler compared with the ground truth (human annotation, treatment known; detection time shifted to 4 h earlier). The number of analyzed images is shown in Supplementary Tables 2022.

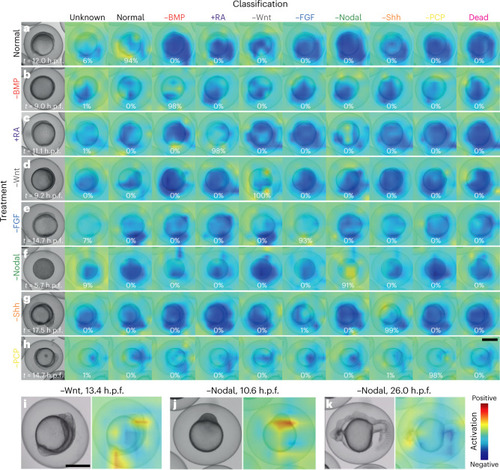
Embryo features activating the neural network.

Class activation heatmaps based on the last convolutional layer of EmbryoNet-Prime showing the part of the image that activates the network at the given timepoint for normal (a) and signaling-defective embryos (bh). Every signaling-defective embryo (−BMP (b), +RA (c), −Wnt (d), −FGF (e), −Nodal (f), −Shh (g), −PCP (h)) is displayed in all classification channels, but only the classification channels corresponding to the correct signaling manipulation show warm colors. The percentages represent the probability of detection. See Supplementary Note 3 for sample sizes. Also see Supplementary Videos 924. ik, Selected embryos showing defects highlighted by the corresponding class activation heatmaps for −Wnt at 13.4 h.p.f. (i) and −Nodal at 10.6 h.p.f. (j) and 26 h.p.f. (k). Scale bars, 500 µm.

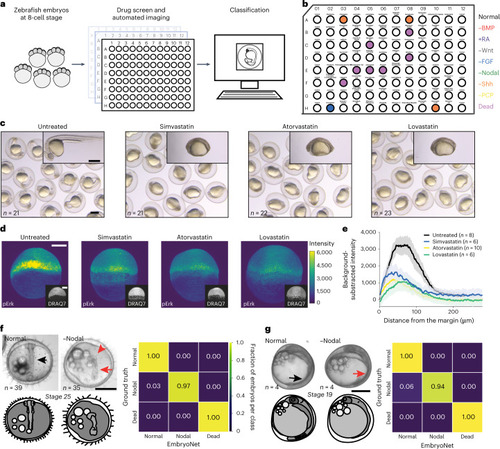
Applications of EmbryoNet in drug screening and other species.

a,b, Automated phenotype-based drug screening. a, Schematic of the phenomic drug screen. Embryos were exposed to compounds in 96-well plates and imaged for 24 h. Phenotypes were classified automatically by EmbryoNet. b, Layout of BML-2843 library plate 2 with majority phenotype classification for each well. Simvastatin in well H-02 was classified as −FGF. c, Statins identified by EmbryoNet in the drug screen caused body axis defects similar to −FGF loss-of-function phenotypes. d, Representative immunofluorescence images of the FGF signaling transducer pErk in untreated and statin-treated embryos, respectively. The representative images have pErk profiles that are closest to the mean signaling profile of each group. Images are shown at the same contrast and brightness. The inserted lower panels show cell nuclei labeled with DRAQ7. e, Quantification of background-subtracted pErk fluorescence intensity gradients in wild-type (black), simvastatin-treated (blue), atorvastatin-treated (yellow) and lovastatin-treated (green) embryos along the marginal-to-animal pole axis. The error envelopes show s.e.m. f,g, Extension of EmbryoNet to other species. f, Images of wild-type (left) and Nodal-deficient (right) medaka embryos with the confusion matrix of classification performance. g, Images of wild-type (left) and Nodal-deficient (right) three-spined stickleback embryos with the confusion matrix of classification performance. Black arrows point to somites in healthy embryos, while red arrows point out missing somites. The red arrowhead shows a mispatterned central nervous system. Scale bars: 500 µm (c,f,g) and 200 µm (d).

Acknowledgments
This image is the copyrighted work of the attributed author or publisher, and ZFIN has permission only to display this image to its users. Additional permissions should be obtained from the applicable author or publisher of the image. Full text @ Nat. Methods