IMAGE

Fig. 1

ID
ZDB-IMAGE-230613-29
Source
Figures for Čapek et al., 2023
Image
Figure Caption

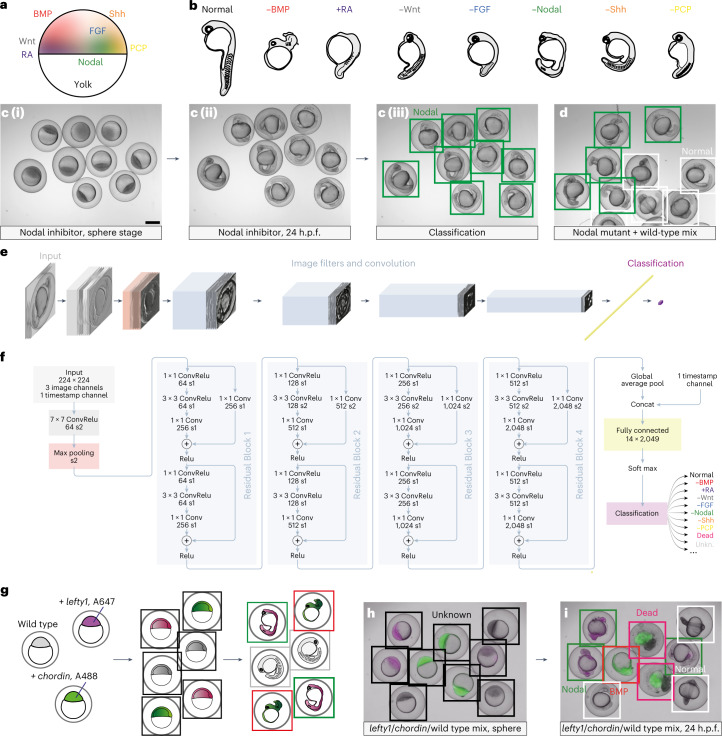
Fig. 1 The CNN EmbryoNet robustly identifies molecular defects based on phenotype data.

a, Simplified schematic of signaling domains during zebrafish development projected onto an early embryo. b, Schematic drawings of zebrafish embryo phenotypes. −BMP loss of function causes reduced and often curled tails, +RA gain-of-function embryos lack head structures and have shortened tails, −Wnt leads to enlarged heads and shortened tails, −FGF causes loss of mesoderm and tail tissue, −Nodal embryos lack mesoderm and have cyclopia, −Shh embryos frequently have mispatterned somites and cyclopia, and −PCP leads to a shortened and widened body axis, manifested, for example, by shorter somites. c,d, Treatment with the chemical Nodal inhibitor SB-505124 caused specific phenotypes that were not yet apparent at sphere stage (c (i)), but which were clearly visible at segmentation stages (c (ii)); n = 36. The inhibitor treatment (c (iii)) phenocopied the MZoep (d) mutant, and both phenotypes were robustly identified by EmbryoNet; n = 58. e,f, Schematic overview of the neural network architecture with convolutional (Conv) layers shown in blue. Stack sizes after each image filter are illustrated in e, whereas f details the filters of the network. Relu, rectified linear unit. gi, EmbryoNet correctly classified embryos in a mixed population. g, Experimental set-up. Embryos at the one-cell stage were injected with mRNA encoding the Nodal inhibitor Lefty1 and Alexa647-labeled dextran (magenta), mRNA encoding the BMP inhibitor Chordin and Alexa488-labeled dextran (green), or were left uninjected (wild type) and then imaged. Black bounding boxes indicate the class Unknown; green indicates −Nodal; red indicates −BMP; white indicates Normal and magenta indicates Dead. h, At the sphere stage, EmbryoNet labeled the phenotypes as Unknown. Dextran-labeling shows the applied treatment. i, During segmentation stages the Normal, −BMP and −Nodal samples were correctly identified by EmbryoNet. The classification is in accordance with the dextran colors; n = 85. Scale bar, 500 µm.

Acknowledgments
This image is the copyrighted work of the attributed author or publisher, and ZFIN has permission only to display this image to its users. Additional permissions should be obtained from the applicable author or publisher of the image. Full text @ Nat. Methods